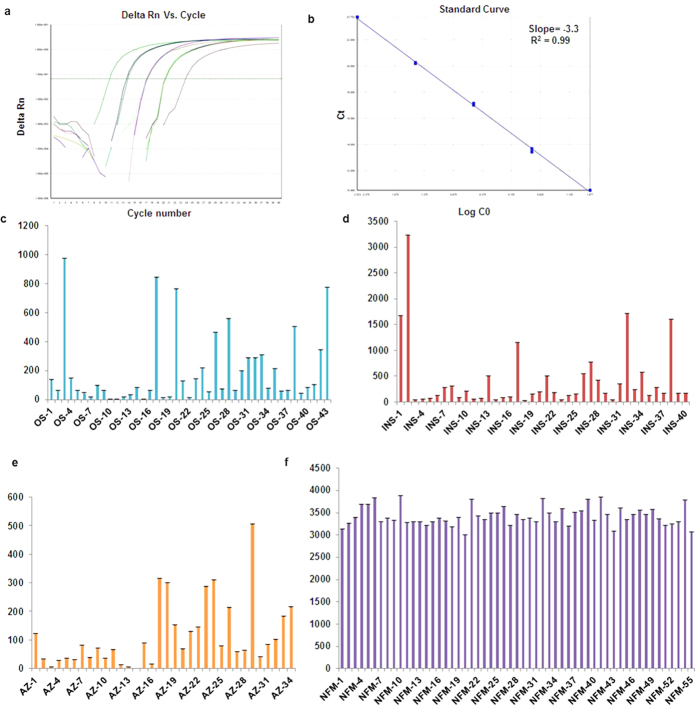
Figure 5. Copy number analysis of DYZ1 arrays by qPCR.
Representative amplification plot (a) and standard curve (b) used for the copy number calculation of DYZ1 arrays. The bar graphs (c–f) show the distribution of copies in the males of different categories including oligospermic (43), infertile males with normal spermiogram (40), azoospermic (34)and normal fertile males (55) respectively. All the reactions were performed in triplicates and the results shown here are average of these triplicates.

