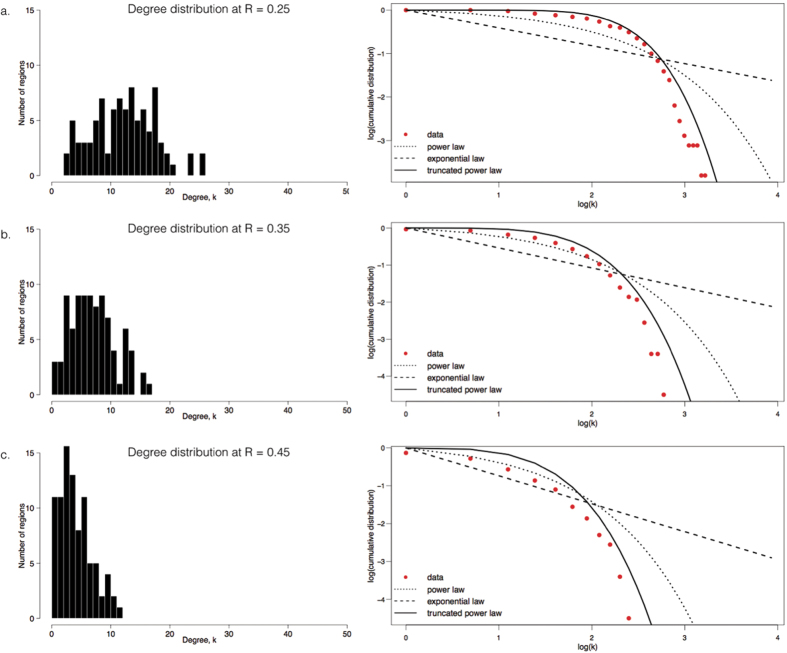
Figure 3. Heavy tailed degree distribution of neonate brains.
Right-tailed degree distribution, p(k), of group-averaged neonate networks thresholded at R 0.25 (A), 0.35 (B) and 0.45 (C) is shown. This pattern becomes more apparent as the threshold increases and the network gets sparser. (A–C), left, shows histograms of degree distributions; right panels show log-log plots of cumulative distribution versus degree. Best fit for data (+) is an exponentially truncated power law (··), compared to power law (––) and exponential law (--).

