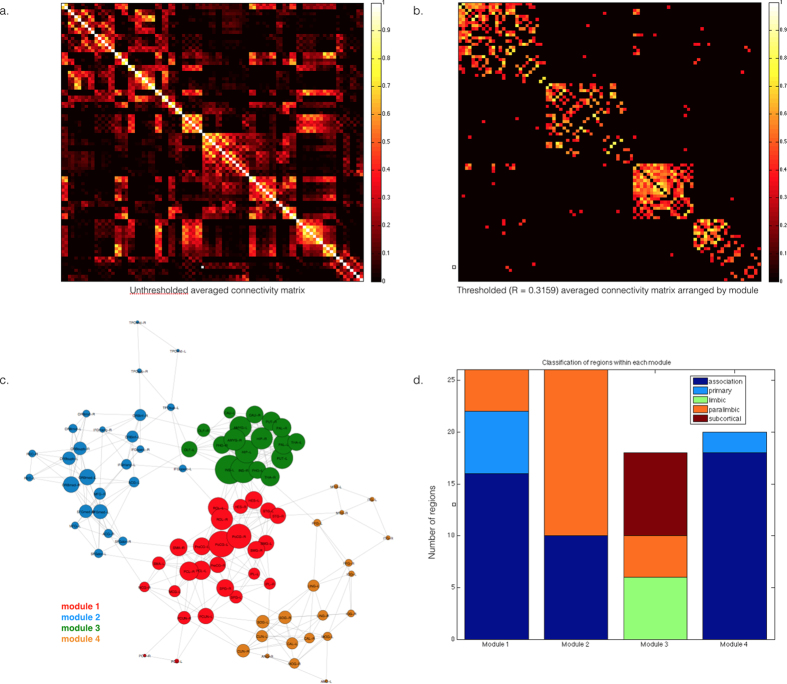
Figure 5. Modular organization of the neonate brain.
The Louvain algorithm was used to identify modules. (A) shows the unthresholded, averaged connectivity matrix for 60 neonates and (B) shows the nodes arranged by module, and by decreasing degree within each module. (C) shows the four functional modules identified in the neonate brain. The network is shown using a Kamada-Kawai layout as implemented in the R package igraph; the graph distance between two nodes determines their location in the layout. Node sizes reflect the degree, k, of each node. Colors reflect module membership. Classification of node in the modules following Mesulam60 is shown in (D).

