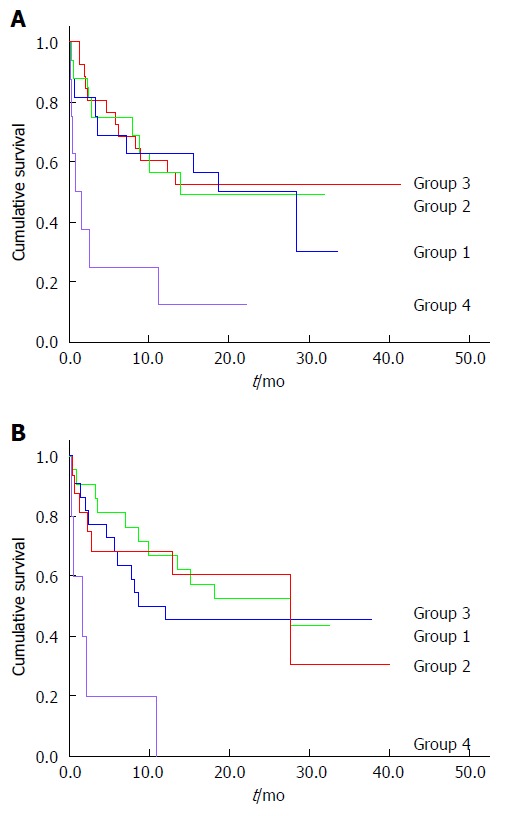
Figure 2.

Caloric and protein intake and survival. A: Caloric intake and survival. Group 1: Caloric intake > 75% of recommended; Group 2: Caloric intake 50%-75% of recommended; Group 3: Caloric intake 25%-50% of recommended; Group 4: Caloric intake < 25% of recommended. Lower survival rates in group 4 vs 1 (P = 0.014), group 4 vs 2 (P = 0.017) and group 4 vs 3 (P = 0.002). Pairwise comparisons between groups 1, 2 and 3 (not significant); B: Protein intake and survival. Group 1: Protein intake > 75% of recommended; Group 2: Protein intake 50%-75% of recommended; Group 3: Protein intake 25%-50% of recommended; Group 4: Protein intake < 25% of recommended. Lower survival rates in group 4 vs 1 (P < 0.001), group 4 vs 2 (P = 0.003) and group 4 vs 3 (P = 0.005). Pairwise comparisons between groups 1, 2 and 3 (not significant).
