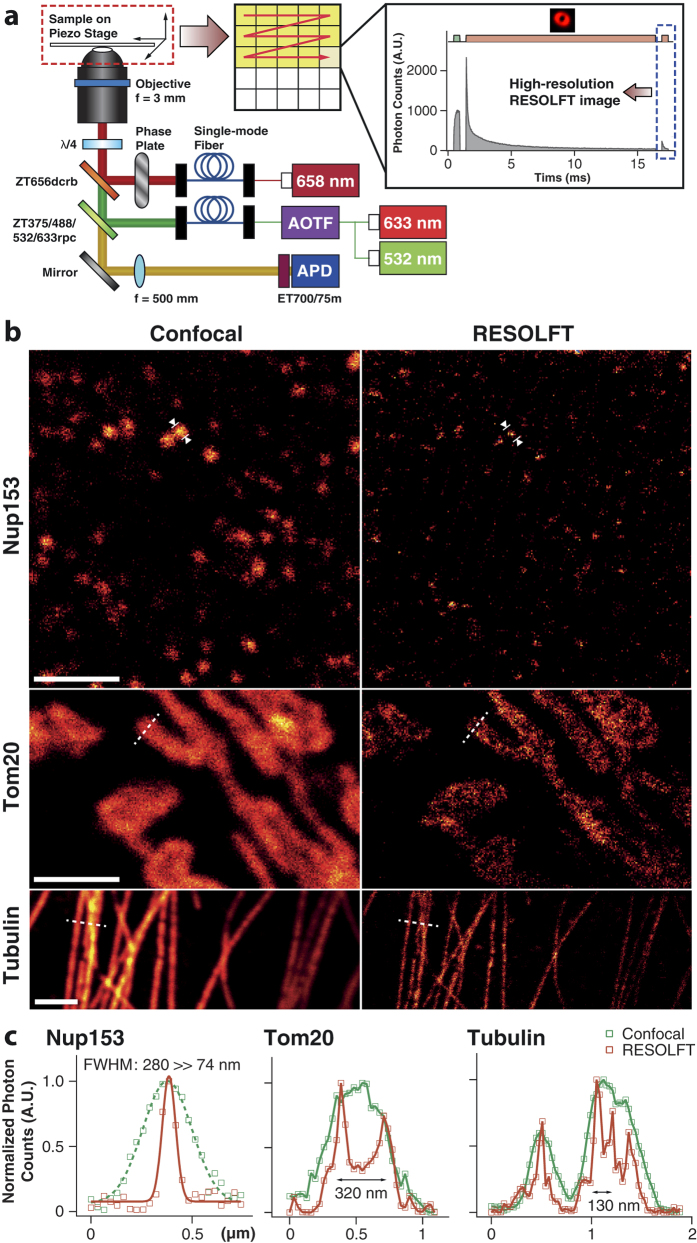
Figure 4.
(a) RESOLFT nanoscopy setup and schematic illustration of RESOLFT imaging. Activation, depletion and probe beams are sequentially applied to every pixel during sample scanning (along the red arrow). The probe beam reads out the emitted photons from the reduced effective focal volume. (b) Confocal (left) and RESOLFT (right) images of subcellular structures in fixed cells stained with the Cy3-Alexa647 heterodimer. (Nup153: nuclear pore complex in NIH3T3 cells; Tom20: mitochondria in primary Human-skin-fibroblast cells; Tubulin: microtubules in primary Human-skin-fibroblast cells). All images are raw data. Scale bars: 2 μm. (c) Fluorescence line profiles along the white marked region (Nup153) and white dotted lines (Tom20 and Tubulin) in (b).

