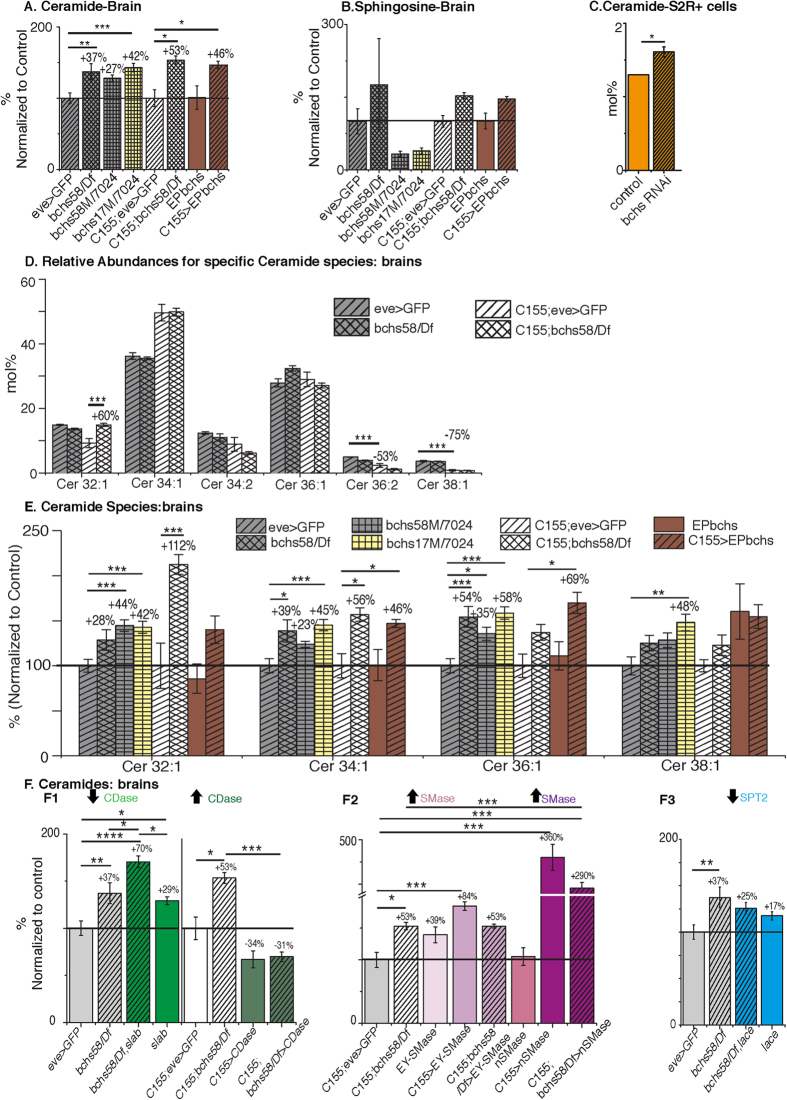
Figure 2. Increased ceramide levels with bchs reduction.
(A) Total ceramide levels are significantly increased in bchs58/Df, bchs17M/7024, C155; bchs58/Df larval brain, and by overexpression in CNS via C155 > EPbchs (EP2299). (B) Abundance of C14-sphingosine in larval brain as determined by LC-MS3 analysis. (C) Ceramide levels in S2R + cells treated with or without (control) bchs RNAi, (D) Relative distribution profiles for ceramide species in larval brain profiles are similar for bchs58/Df (double hatched bars) in the two genetic backgrounds, with or without C155. Cer 32:1 is changed in bchs in the C155; eve > GFP background. (E) Major ceramide species in brains compared across the allelic combinations show significant increases in one or more of the major species. (A,B,E) Bars represent mean ± SEM of percent change for lipids (quantified as picomoles/brain) with respect to the genetic controls, eve-Gal4 driving UASmCD8GFP (eve > GFP; grey hatched bars) alone or in combination with C155-Gal4 (C155; eve > GFP; white hatched bars). The control level of 100% is indicated by a horizontal line. (C-D) Bars represent percent molar ratios for total ceramides (normalized to phospholipids) measured from S2R + cells (C) and for ceramide species measured from larval brains (D,F). Modifiers of bchs degeneration change ceramide levels. F1. CDase heterozygote slab2/+ increases total ceramides and rescues the degeneration whereas CDase overexpression lowers ceramide levels. F2. nSMase overexpression markedly increases ceramide. F3. lacek05305/spt2 heterozygotes do not affect ceramide levels. Bars represent mean ± SEM of percent change with respect to genetic control of total ceramide (quantified as picomoles/brain) for manipulations of CDase (slab) (1), nSMase (2) and Spt2 (lace) (3). Color and hatching schemes represent different bchs allelic combinations or bchs combined with a given genetic background. Numbers represent percent change relative to the genetic control, set to 100% (indicated by horizontal line). Statistical significance between 2 genotypes is indicated by *p < 0.05, **p < 0.005 and ***p < 0.0005 as determined by ANOVA followed by post-hoc Tukey analyses. Lipidome-wide changes are shown in supplementary sections S1 and S2. Changes in specific ceramide species are summarized in supplementary Figures S3–S5.

