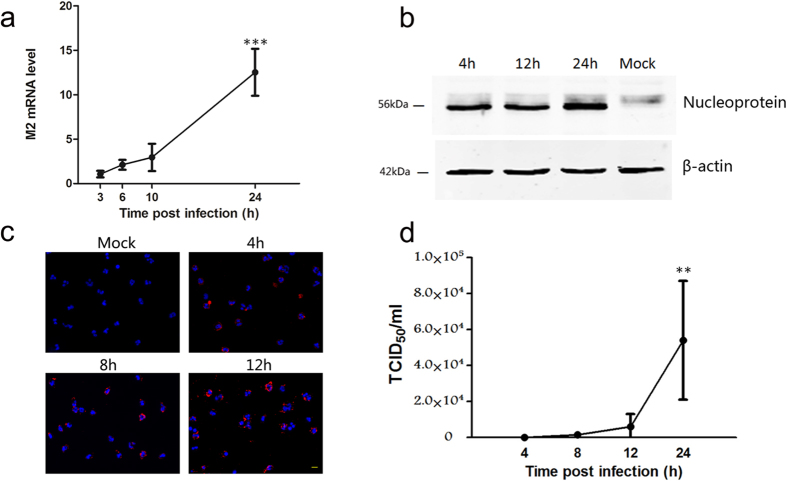
Figure 3. 2009 A (H1N1) Influenza Virus replicated in and released from Human neutrophils in vitro.
(a) Time course of 2009 A (H1N1) virus matrix 2 (M2) mRNA synthesis was analyzed with Real-time PCR. Data are shown as mean ± S.D. ***P < 0.001, indicate statistically highly significant differences of M2 mRNA expression at 24 h post infection comparing with its expression at 3 h, 6 h and 10 h post infection (P = 0.0001, 24 h vs 3 h post infection; P = 0.0002, 24 h vs 6 h post infection; P = 0.0008, 24 h vs 10 h post infection), n = 4. (b) The accumulation of virus Nucleoprotein at different time points post infection was examined with Western blot. (c) In situ analysis of 2009 A (H1N1) virus matrix 1 (M1) protein synthesis at different time points post infection with immunofluorescence. Scale bar, 20 μm. (d) The influenza virus titers of supernatants from infected neutrophils at different time points post infection were examined with the TCID50 assay. Data are shown as mean ± S.D. *P < 0.05, indicate statistically highly significant differences of virus titers at 24 h post infection comparing with virus titers at 4 h, 8 h and 12 h post infection (P = 0.0168, 24 h vs 4 h post infection; P = 0.0189, 24 h vs 8 h post infection; P = 0.029, 24 h vs 12 h post infection), n = 4.

