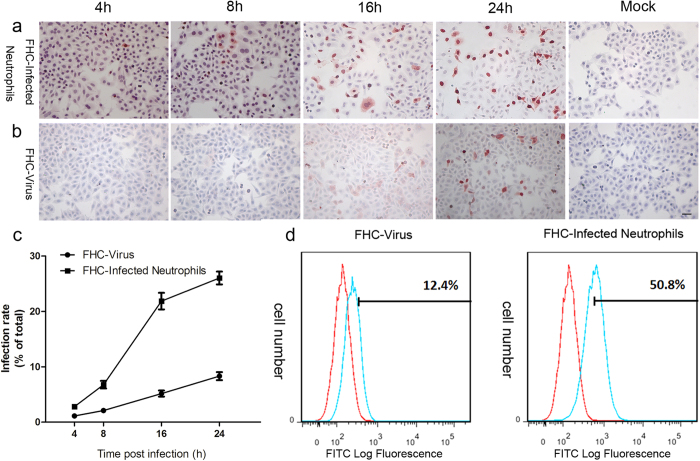
Figure 4. The infectivity of progeny virus released from neutrophils was examined with cell co-culture.
(a,b) Immunocytochemistry shows time course of 2009 A (H1N1) virus Nucleoprotein expression in FHC cells co-cultured with infected neutrophils or incubated with parent 2009 A (H1N1) virus directly. Scale bar, 20 μm. (c) Statistical data of different cell infection rates between (a,b), n = 4. (d) Flow cytometry shows the comparison of different cell infection rates between FHC cells incubated with 2009 A (H1N1) virus directly and FHC cells co-cultured with infected neutrophils at 24 h post infection using FITC-conjugated mouse anti-Nucleoprotein antibody (blue curve), uninfected neutrophils were used as negative control (red curve).

