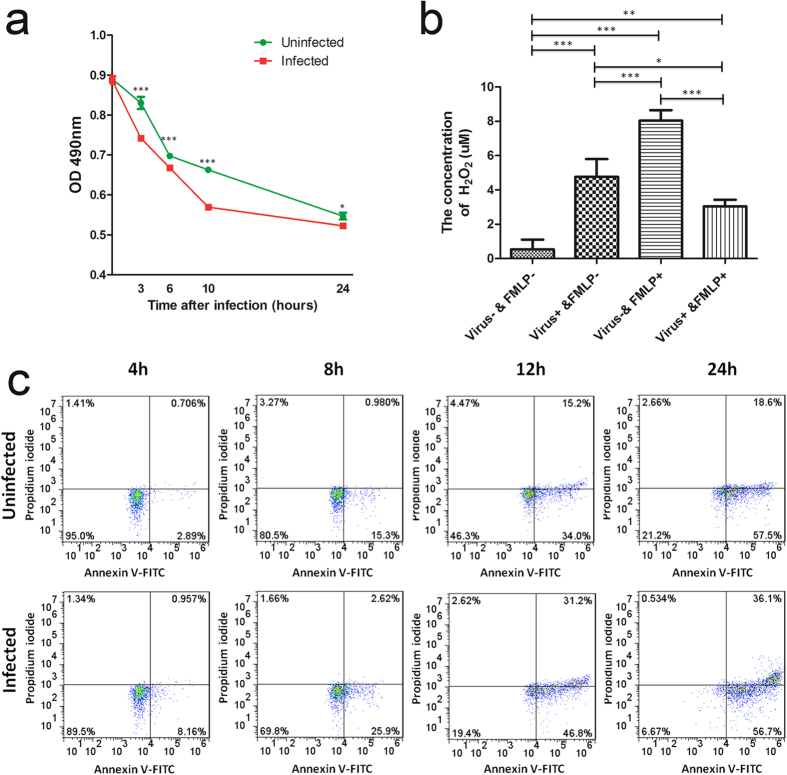
Figure 5. The conditions of neutrophils before and after infection with 2009 A (H1N1) virus.
(a) The viability of infected neutrophils was significantly lower than that of the uninfected neutrophils examined with MTS assay. Data are shown as mean ± S.D. *P < 0.05, ***P < 0.001, n = 3. Differences between infected and uninfected samples were analysed with Student’s t-test. (b) Hydrogen Peroxide production of neutrophils was higher following treatment with virus for 30 min than the untreated controls (Virus+ & FMLP– vs Virus– & FMLP–); but it also depressed H2O2 production of neutrophils to mount respiratory burst responses to FMLP (Virus+ & FMLP+ vs Virus- & FMLP+). Data are shown as mean ± S.D. *P < 0.05, **P < 0.01, ***P < 0.001, n = 3. Differences among groups were analysed with One-way ANOVA. Comparisons between any two groups were performed with q-test (Newman-Keul’s test). (c) Influenza virus accelerated neutrophil apoptosis, which was proved with Annexin V-FITC/PI staining at different time points post infection.

