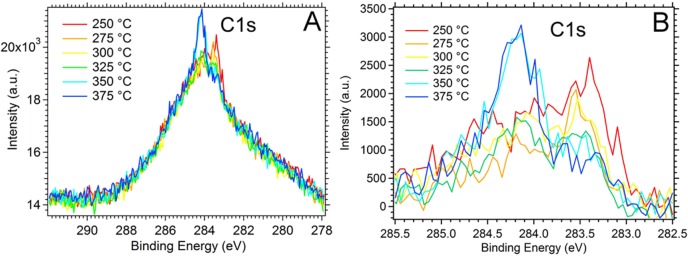
Figure 3.
In situ X-ray photoelectron spectra of the C 1s region obtained during exposure of the Ni foil to 0.02 mbar methane at the indicated temperatures after sample pretreatment as described in Figure 1. Photon energy: 425 eV. Amorphous background shown (A) and subtracted from spectra (B) as it does not participate in the carbide/graphene kinetics in the chosen temperature region.

