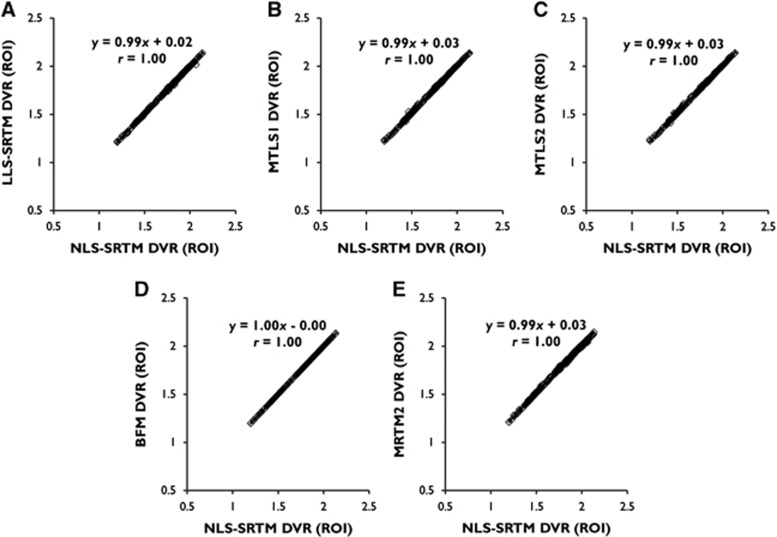
Figure 3.
Linear relationship between distribution volume ratios (DVRs) from several linear estimation methods based on the simplified reference tissue model (SRTM) and those from the SRTM using nonlinear least squares (NLS-SRTM) for region-of-interest (ROI) TACs from dynamic [11C]ABP688 positron emission tomography (PET) data. (A) LLS-SRTM; (B) MTLS1; (C) MTLS2; (D) BFM; (E) MRTM2. Individual points in each scatter plot correspond to the DVR pairs from individual ROI TACs in the left and right sides of the caudate nucleus, hippocampus, putamen, and thalamus of total 30 participants. BFM, basis function method; LLS, linear least squares; MRTM2, multilinear reference tissue model with two parameters; MTLS, mixed LS-TLS; MTLS1, multilinear SRTM based on MTLS considering only tissue concentration CT(t) as noisy data; MTLS2, multilinear SRTM based on MTLS considering both CT(t) and reference region concentration CR(t) as noisy data; TAC, time-activity curve; TLS, total least squares.

