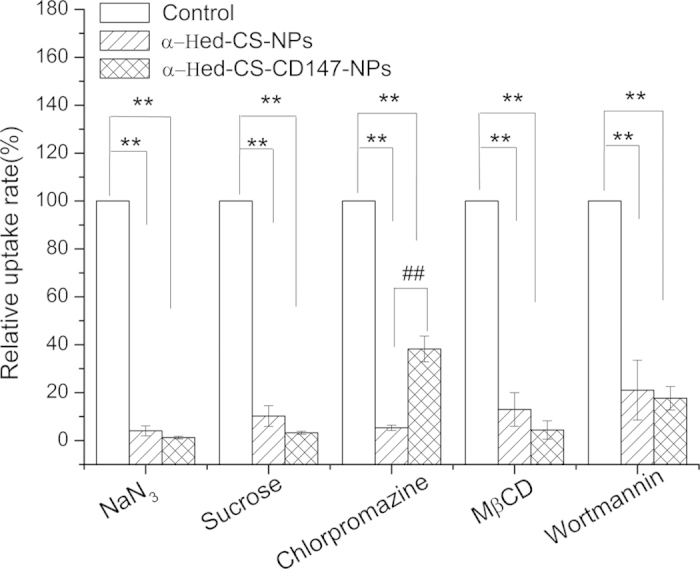
Figure 9. Influence of different endocytosis inhibitors on HepG2 cell uptake.

HepG2 cells were pretreated with NaN3 (200 μg/mL), sucrose (0.45 M), chlorpromazine (7 μg/mL), methyl-β-cyclodextrin (MβCD, 3 nM), and wortmannin (500 nM) for 1 h and then incubated with FITC-labeled α-Hed-CS-NPs and α-Hed-CS-CD147-NPs for 2 h (n = 3). *p < 0.05 and **p < 0.01 versus control. #p < 0.05 and ##p < 0.01 versus α-Hed-CS-NPs.
