
Fig. 2.
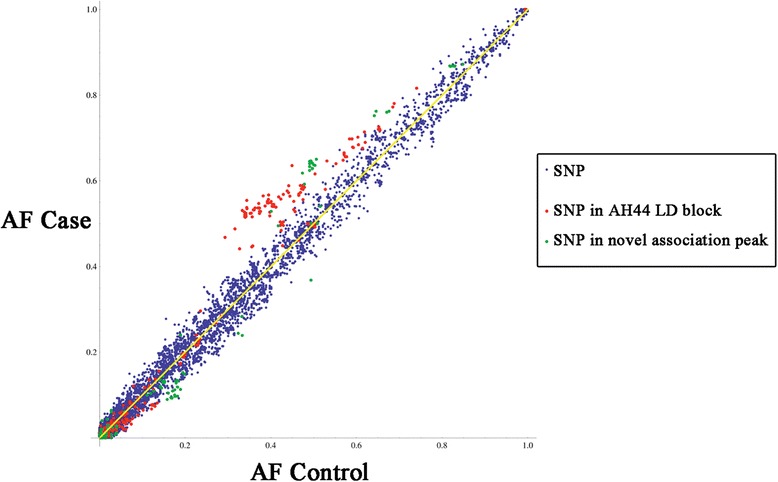
Allele frequencies for each variant across the 2 Mb interval compared between controls and cases. Variants within the AH44 LD block are in red and variants in the second association region upstream of IRX5 are in green
Official websites use .gov
A
.gov website belongs to an official
government organization in the United States.
Secure .gov websites use HTTPS
A lock (
) or https:// means you've safely
connected to the .gov website. Share sensitive
information only on official, secure websites.
Allele frequencies for each variant across the 2 Mb interval compared between controls and cases. Variants within the AH44 LD block are in red and variants in the second association region upstream of IRX5 are in green