
Fig. 4.
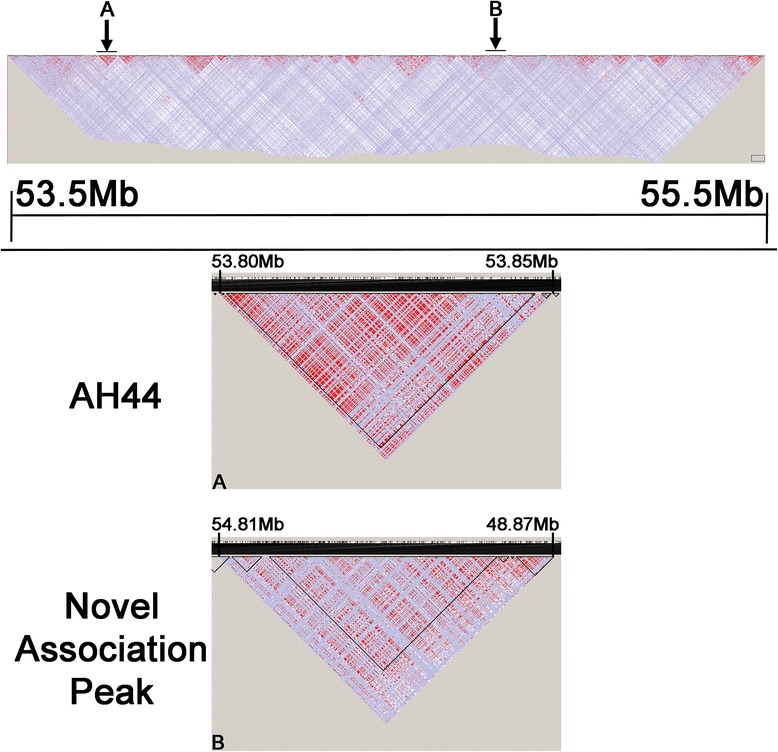
Linkage disequilibrium across the two associated regions. Mountain plots generated by Haploview [38] for (a) rs9939609:T > A associated region chr16:53,797,908-53,846,168 (48.3 kb) and (b) the novel associated region at chr16:54,812,014-54,865,446 (53.4 kb), across our complete study group. Bright red represents D’ = 1 and LOD ≥ 2 (complete dependence and strong evidence for linkage); shades of pink/red represent D’ < 1 and LOD ≥ 2; blue represents D’ = 1 and LOD < 2; white represents D’ < 1 and LOD < 2(low dependency and poor evidence for linkage). The full plot of the region sequenced is shown for reference (chr16:53500000-55500000)