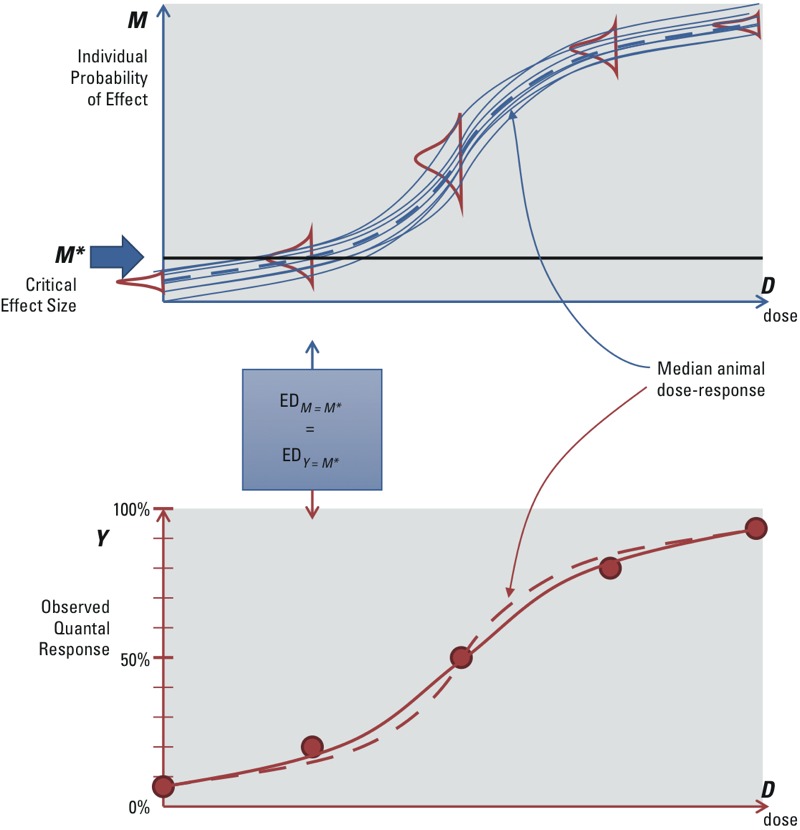
Figure 2.

Stochastic quantal endpoints: quantal responses reflecting individual probability of effect. The dashed lines in the upper and lower panel are the same, representing the (hypothetical) dose response of the median animal. In the upper panel, the solid lines represent (hypothetical) individual dose–response curves. In the lower panel, the solid line reflects the expected value of the observed quantal response from the population of individual responses, which is less steep than the dose response of the median animal.
