
Figure 4.
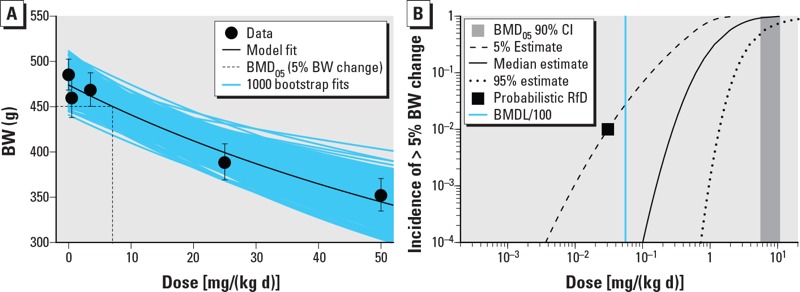
Results of analysis of example continuous dataset [rat body weight (BW) changes] as a function of dose (milligrams per kilogram BW per day). (A) Representative benchmark dose (BMD) modeling results using the Hill model with M* = 5% change. (B) Median estimate and 5th and 95th percentile estimates for the incidence (I) of effects of size > M* (i.e., 5% change in BW) as a function of population exposure [dose; i.e, I≥M*(Dose)]. For reference, also shown are the probabilistic RfDs corresponding to a 1% incidence of effects of size > M* at 95% (one-sided) confidence (black square), the 90% (two-sided) CI for the benchmark dose (vertical gray shaded area), and a deterministic RfD equal to the BMDL/100 (vertical blue line).