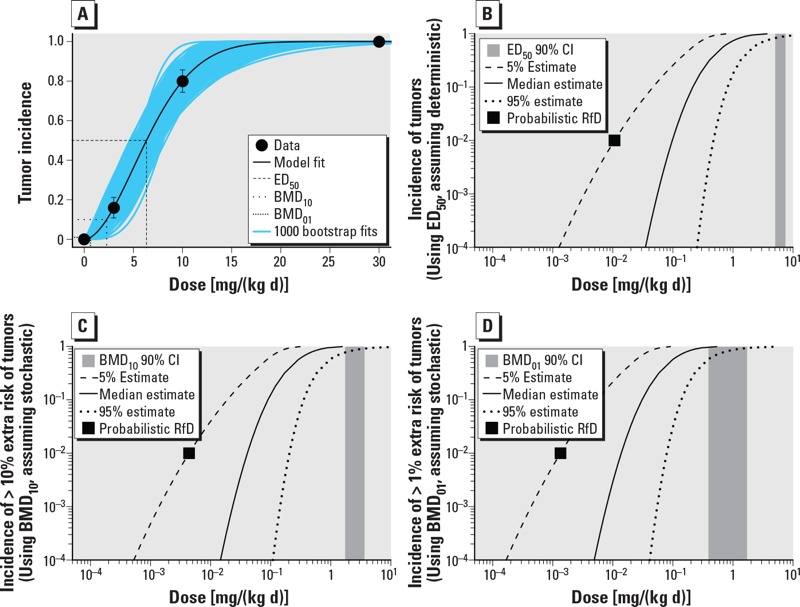
Figure 5.

Results of analysis of example quantal dataset (forestomach tumors in mice) as a function of dose (milligrams per kilogram BW per day). (A) Representative benchmark dose (BMD) modeling results using the Weibull model. Multiple BMD estimates are shown, with the ED50 corresponding to M* = tumor, and the BMD10 and BMD01 corresponding to M* = 10% and 1% extra risk, respectively. (B–D) Median estimate and 5th and 95th percentile estimates ) for the incidence (I) of effects of size > M* as a function of population exposure [dose; i.e, I≥M*(Dose)]. In (B), mouse forestomach tumors are treated as a deterministic quantal endpoint, whereas in (C,D), tumors are treated as a stochastic quantal endpoint [in (C), M* = 10% extra risk; in (D), M* = 1% extra risk)]. For reference, also shown in each panel are the probabilistic RfDs corresponding to a 1% incidence of effects of size > M* at 95% (one-sided) confidence (black square) and the 90% (two-sided) confidence interval (CI) for the benchmark dose (vertical gray shaded area).
