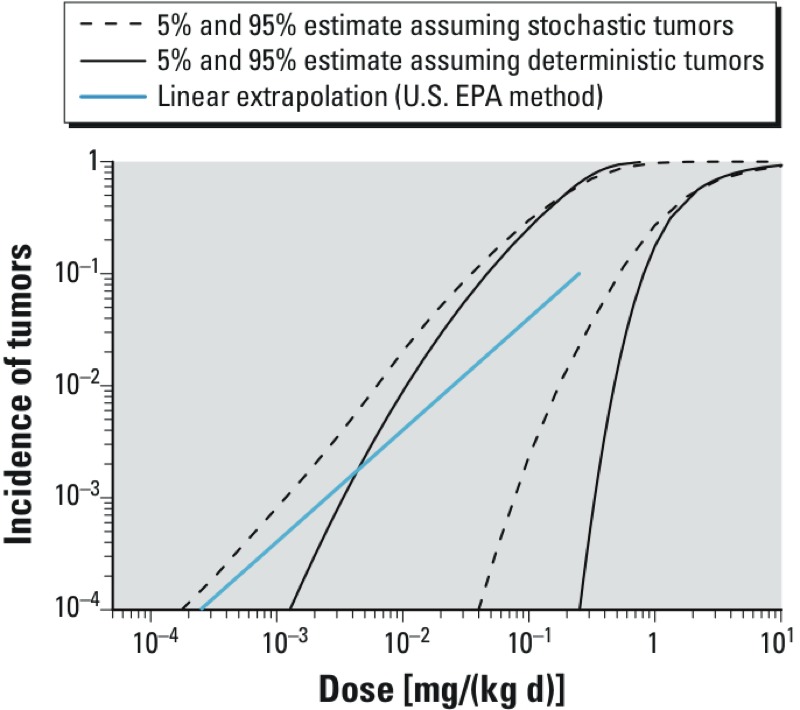
Figure 6.

Comparison of estimated human population tumor incidences as a function of exposure [dose (milligrams per kilogram BW per day)] when treating tumors as a deterministic or a stochastic endpoint. Shown are the 90% (two-sided) CIs for human population tumor incidence calculated from the probabilistic approach, depending on whether tumors in the example dataset are treated as deterministic or stochastic quantal endpoints. For reference, also shown is the population tumor incidence derived using the default U.S. EPA method of linear extrapolation from a point of departure equal to the animal BMDL10 allometrically scaled by multiplying by (BWanimal/BWhuman)0.25 (blue line).
