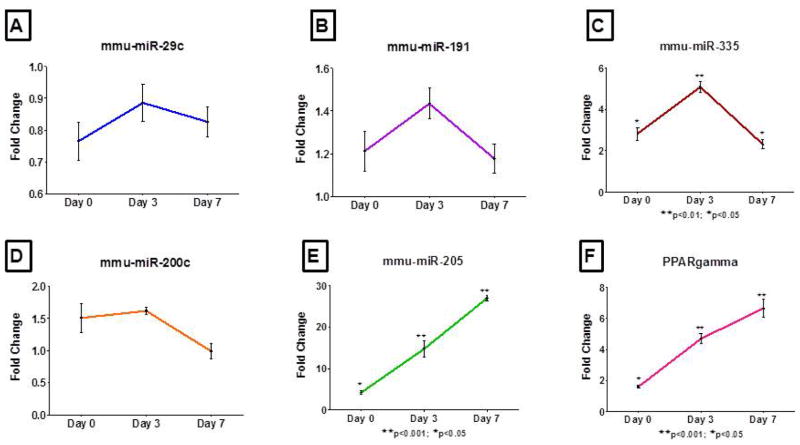
Figure 3.
miRNA expression as assessed by real time PCR at Day 0, 3 and 7 of 3T3-L1 preadipocyte differentiation. miRNA expression for Day 0, 3 and 7 are relative to the preadipocyte levels and snoRNA-234 and 18S rRNA were used as endogenous controls for normalization of miRNA and PPARgamma gene expression respectively. A schematic representation describing the 3T3-L1 adipogenesis paradigm for this study is provided in the supplement (Figure 1).

