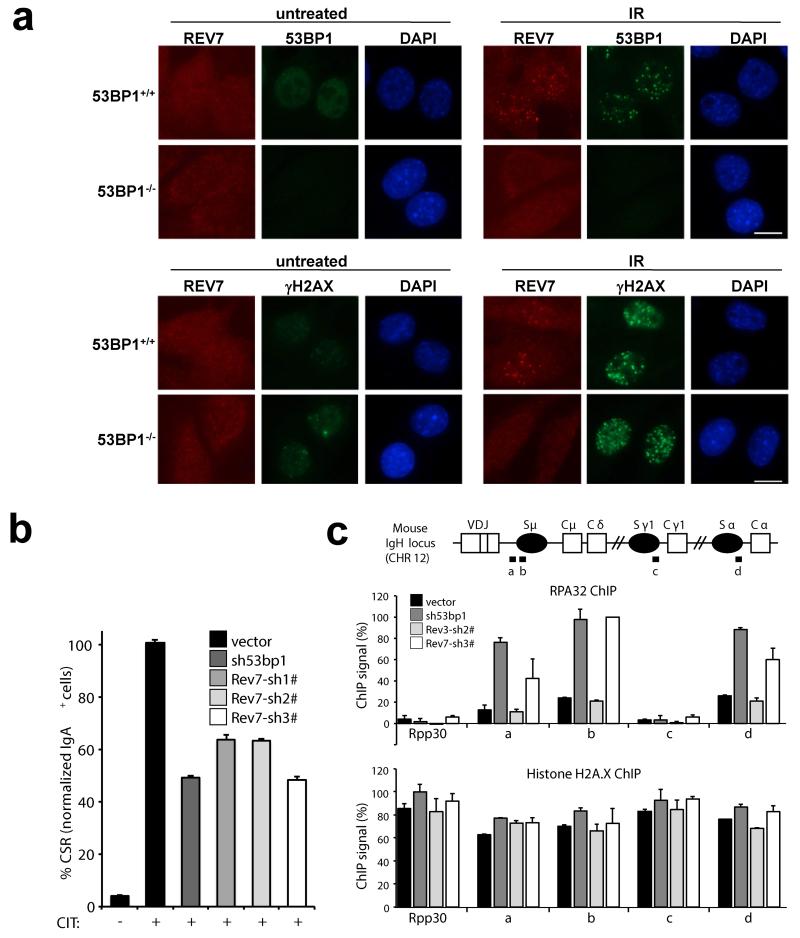
Figure 4. REV7 is a downstream effector of 53BP1 on inhibiting end resection and promoting CSR.
a, REV7 foci formation in 53bp1−/− and 53bp1+/+ MEF cells before and 4h post IR (10 Gy). Scale bar, 10μm. b, Quantification of CSR to IgA of shRNA-transduced CH12 cells 40h post stimulation (CD40Ab, IL-4, TGFβ-1; CIT). Data represent the mean ± SD from two independent experiments performed in triplicate. c, Schematic of IgH locus shows relative positions of qPCR amplicons used in ChIP experiments. A control non- IgH locus (Rpp30) was also examined. Indicated CH12 cell-lines stimulated for 30 h with CIT were subjected to ChIP with IgG (control), histone H2A.X, and RPA32 monoclonal antisera. Following background subtraction, values were normalized to the DNA input signals, followed by the maximum value in each data set. Mean signals, two replicates ± SEM.

