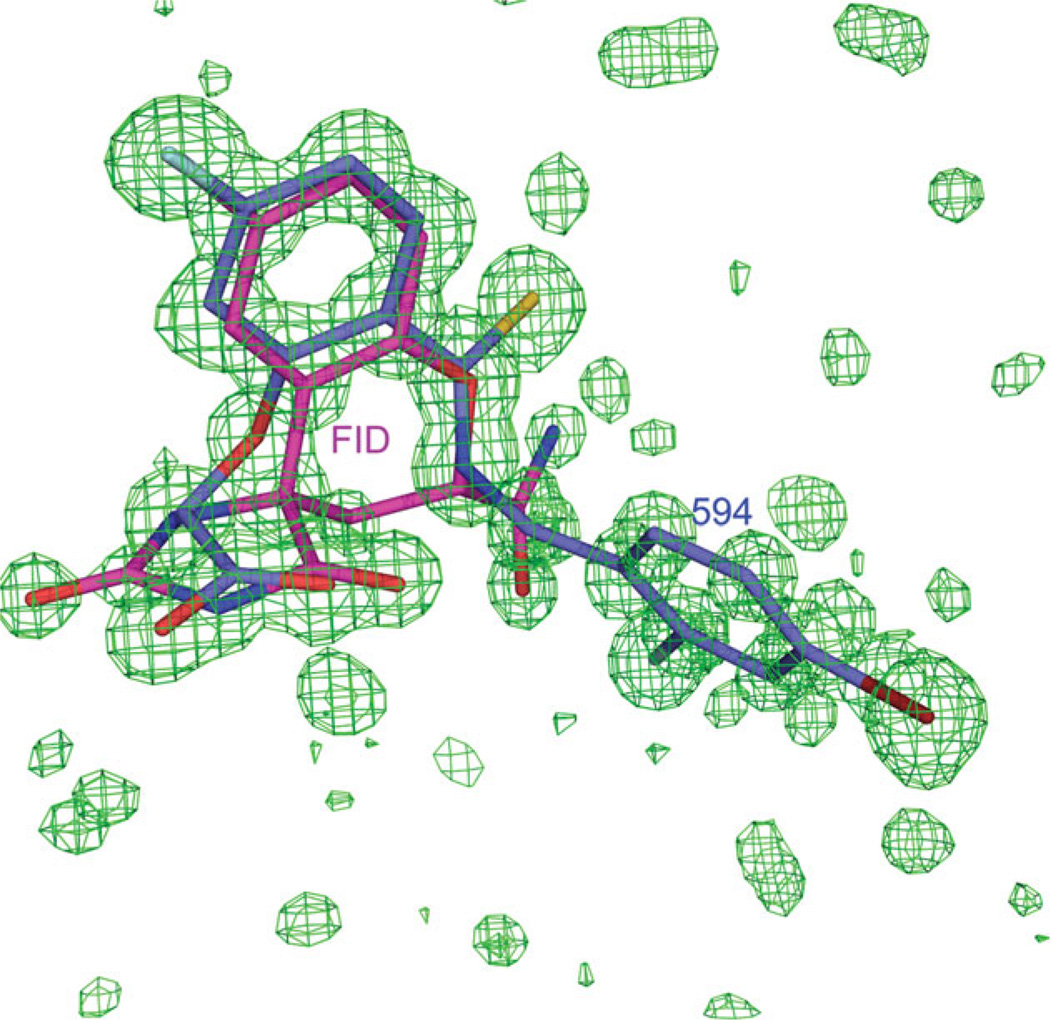
Figure 3.

Difference map for the FID = 594 structure data shows the superposition of the inhibitors 594 and FID in the active site. The Fobs − Fcalc density map in green is contoured at 3σ. The models of the inhibitors 594 and FID are colored in blue and magenta, respectively.
