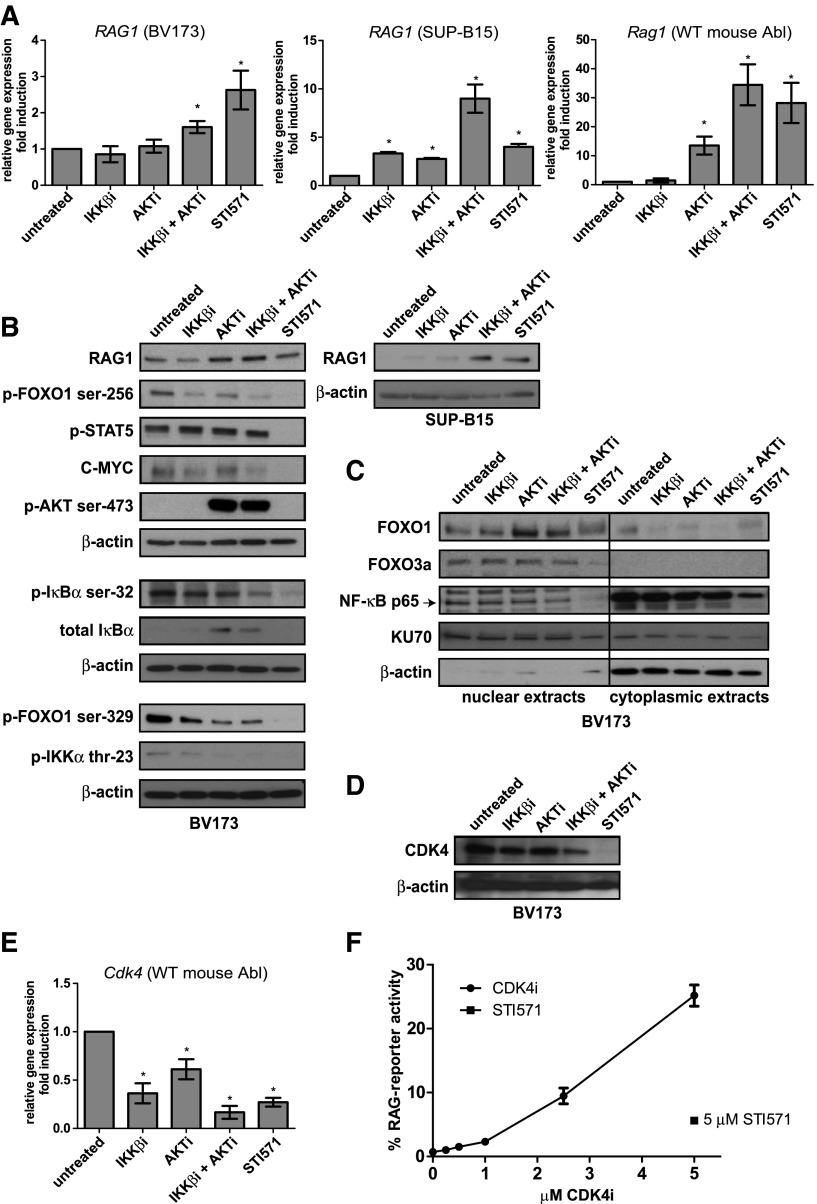
Figure 2.
Transcriptional regulation of RAG1 by the AKT and NF-κB pathways. (A) Real-time reverse transcription PCR (RT-PCR) analysis of RAG1 mRNA in the human BCR-ABL-positive B-ALL cell lines BV173 (left) and SUP-B15 (middle) and Rag1 mRNA in the WT mouse Abl pre-B cell line (right). Cells were treated with 2.5 μM IKKβi, 2.5 μM AKTi, or 10 μM STI571 for 48 hours. (B) Immunoblot analysis of whole-cell extracts from BV173 and SUP-B15 cells treated as in (A). (C) Immunoblot analysis of nuclear and cytoplasmic extracts from BV173 cells treated as in (A). (D) Immunoblot analysis of CDK4 cells treated as in (A). β-actin was used as loading control in (B) and (D). KU70 is expressed in the nucleus and the cytoplasm and was used as loading control in (C). (E) Cdk4 real-time RT-PCR analysis of the WT mouse Abl pre-B cell line; cells were treated as in (A), and results were normalized to those in untreated cells (DMSO vehicle). Real-time RT-PCR results are presented relative to the expression of the housekeeping genes RPLPO (for human cells) and 18S ribosomal RNA (rRNA) (mouse cells); PCRs were performed at least in duplicate, and error bars show means ± SD of 3 independent experiments. (F) Titration curve of CDK4i. RAG-reporter activity of WT mouse Abl pre-B cells treated with 5 μM STI571 is plotted against the concentration of CDK4i. Cells were stimulated for 96 hours. A representative example of 3 independent experiments is shown, 4 replicate measurements were performed per experiment, and error bars represent means ± SD. *P < .05, as determined by the 1-sample Student t test.

