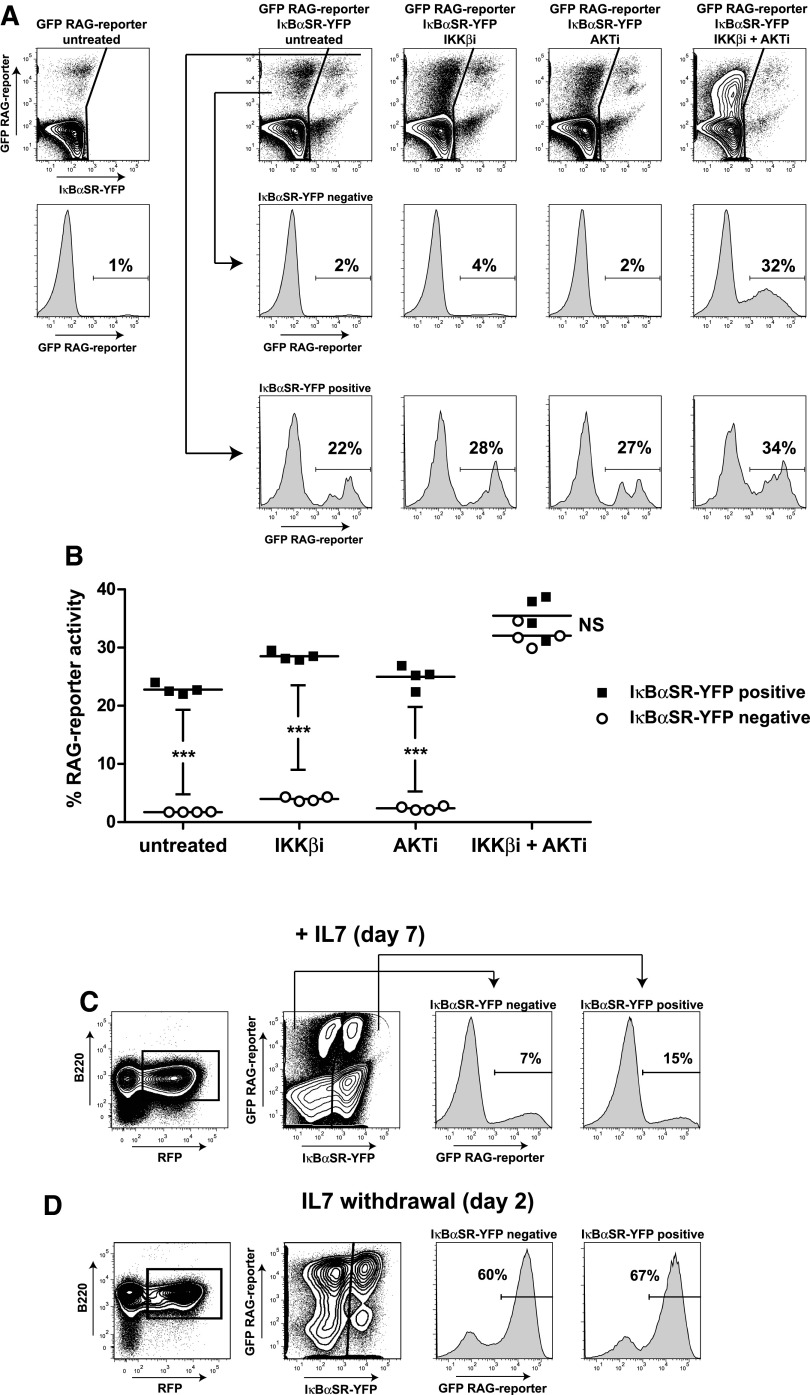
Figure 5.
NF-κB superrepressor augments RAG activity in mouse Abl pre-B cells and in IL7-dependent untransformed mouse pre-B cell cultures. (A) FACS plots of WT mouse Abl pre-B cells transduced with IκBαSR-YFP and RAG-reporter (GFP) IRES-RFP. Scatter plots show YFP (x-axis) vs GFP (y-axis) within RFP-positive gate. Histograms show RAG-reporter (GFP) in IκBαSR-YFP–negative cells (middle row) and in IκBαSR-YFP–positive cells (bottom row). Cells were treated for 96 hours as indicated above FACS plots. Numbers above outlined gates indicate percentage of cells. (B) Graph depicting percentage of RAG-reporter activity (GFP) in IκBαSR-YFP–positive cells and IκBαSR-YFP–negative cells. Horizontal lines represent means, and 4 independent experiments were performed. Statistical significances were determined by two-way ANOVA. (C) FACS scatter plots of untransformed mouse pre-B cells cultured for 7 days with IL7. Pre-B cells (B220+, IgM–CD43+) were retrovirally transduced with IκBαSR-YFP and RAG-reporter (GFP) IRES-RFP constructs. Gating strategy is shown (B220+RFP+). FACS histograms show RAG-reporter activity (GFP) in IκBαSR-YFP–negative and IκBαSR-YFP–positive cells. A representative example of 3 independent experiments is shown. (D) RAG-reporter activity (GFP) 2 days after IL7 withdrawal. Numbers above outlined gates indicate percentage of cells. A representative example of 2 independent experiments is shown. ***P < .001.

