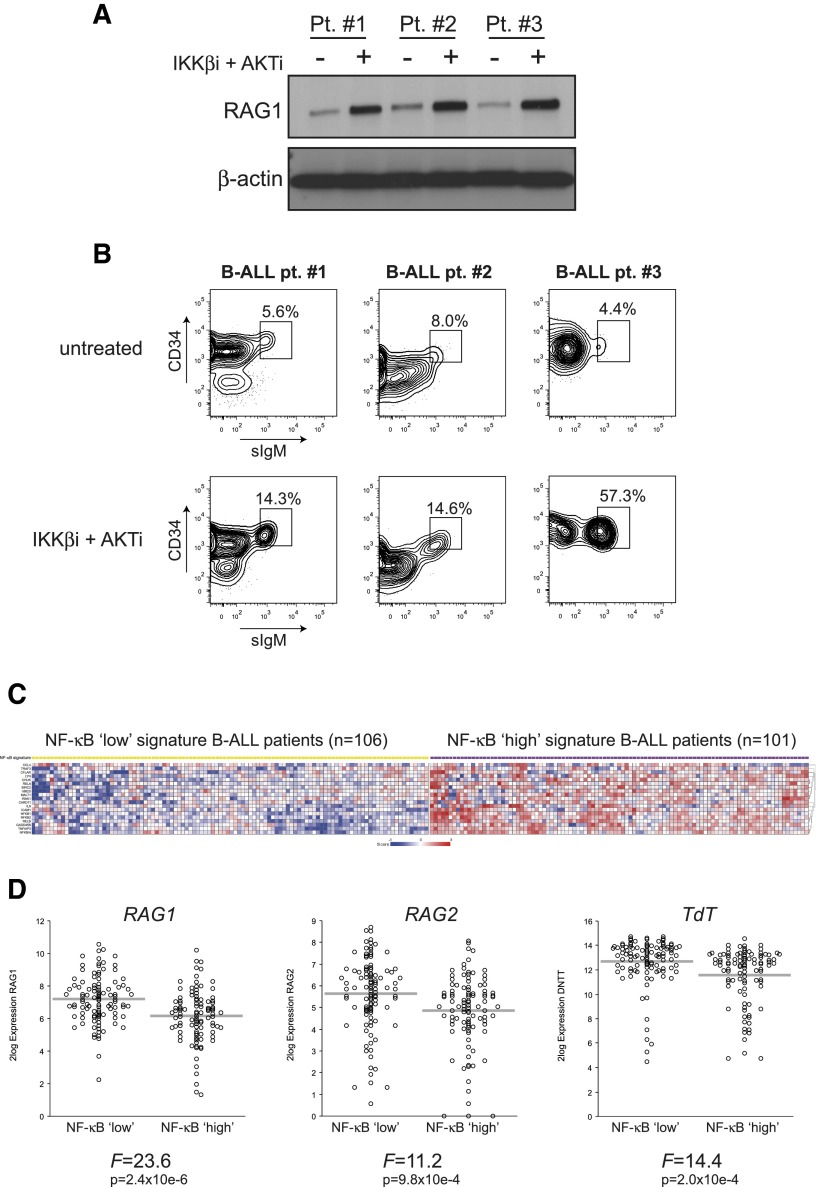
Figure 6.
Inhibition of AKT and NF-κB signaling induces RAG1 protein expression in primary human B-ALL cells, and NF-κB gene expression signature negatively correlates with RAG1, RAG2, and TdT mRNA expression in untreated B-ALL patients. (A) Immunoblot analysis of whole-cell extracts from primary (BCR-ABL-negative) B-ALL blasts (n = 3) cultured for 48 hours with 2.5 μM IKKβi and 2.5 μM AKTi or vehicle (DMSO; untreated). (B) FACS plots of primary human B-ALL cells from 3 patients cultured for 48 hours with 2.5 μM IKKβi and 2.5 μM AKTi or vehicle (DMSO; untreated). FACS plots show CD34 vs surface IgM (sIgM) expression within the CD19+ gate; gated events were CD10+ (data not shown). Numbers above outlined gates indicate percentage of cells. (C) Heatmap showing NF-κB low (yellow squares) and NF-κB high (purple squares) B-ALL patient subgroups based on a 19 NF-κB pathway/target classifier gene expression profile. Each column represents a B-ALL patient, and each row represents a unique gene classifying the 2 subgroups. (D) Relative RAG1, RAG2, and TdT mRNA expression in NF-κB low and NF-κB high signature B-ALL patients. Each circle represents an individual patient, 2log expression is depicted, and gray bars indicate means. The ANOVA F-statistic and P value are given below each graph.

