
Figure 6.
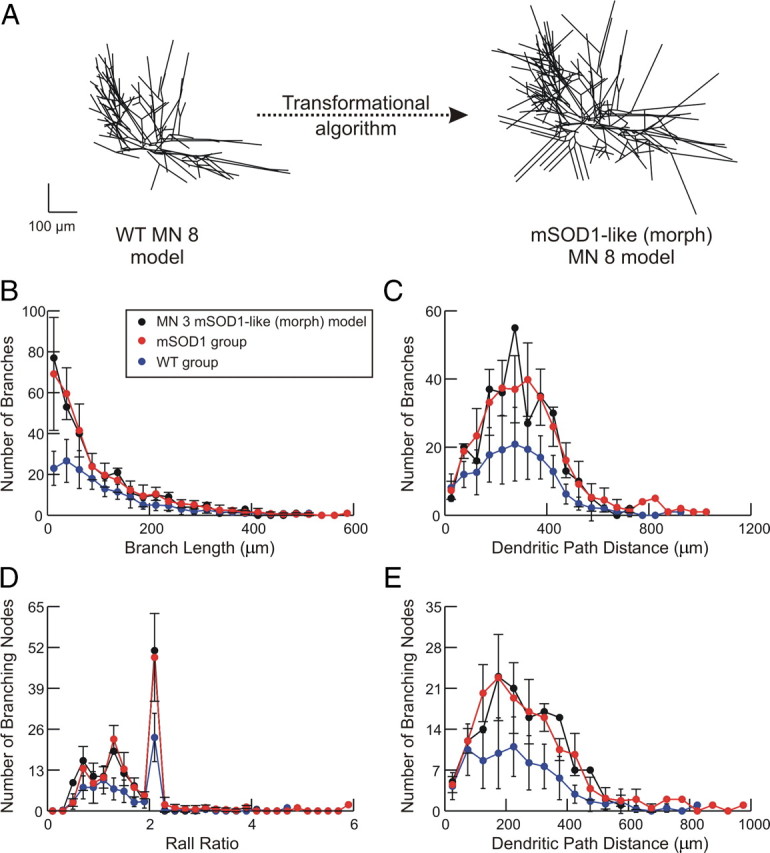
Transformation of WT to mSOD1-like models. A, Transformation of WT MN 3 model to its comparable mSOD1-like (morph) model. B–E, Morphometrical properties of mSOD1-like (morph) models. Data of reconstructed WT (blue traces) and mSOD1 (red traces) motoneurons are plotted versus that of the MN 3 mSOD1-like (morph) model (black traces). All error bars represent SD n = 8 for WT data and n = 6 for mSOD1 data.