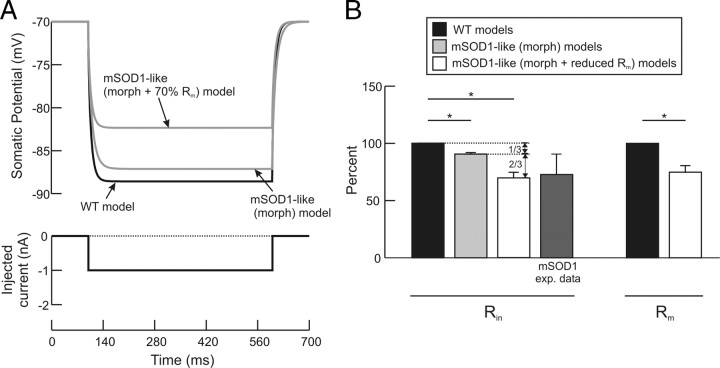
Figure 7.
Simulations of mSOD1-like (morph) models. A, Rin measurement in WT and mSOD1-like (morph) models. The mSOD1-like (morph) morphology merely resulted in 10% reduction in Rin; however, the experimentally observed reduction in Rin was obtained when Rm was simultaneously reduced by 30%. B, Summary of mSOD1-like (morph) and mSOD1-like (morph + Rm) simulation results. For each mSOD1-like (morph + Rm) model, Rin was reduced on average by 10% (second bar) due to morphology increase alone, and by 30% (third bar) when Rm was concurrently reduced in the model, which matched mSOD1 experimental data (fourth bar). Accordingly, the morphology increase contributed one third of the decrease in Rin, whereas Rm reduction contributed the other two thirds (see vertical arrows). Rm was reduced on average by 25% in mSOD1-like (morph + Rm) models to match Rin experimental data (last bar). n = 8 for WT, mSOD1-like (morph), and mSOD1-like (morph+ Rm) models. Error bars represent SD.

