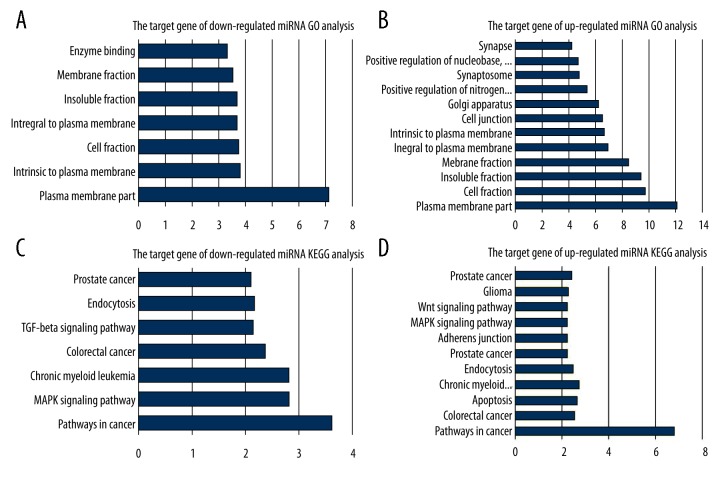
Figure 4.
GO (A, B) and KEGG (C, D) analysis of target genes of differentially expressed miRNAs. The horizontal axis is the significance degree, the vertical axis is the functional annotation. A larger value of degree of significance corresponds to a stronger correlation between the target genes and annotation.

