
Table 4.
Navigation Success Rate and Time for 1.5-T versus 3-T MR Imaging
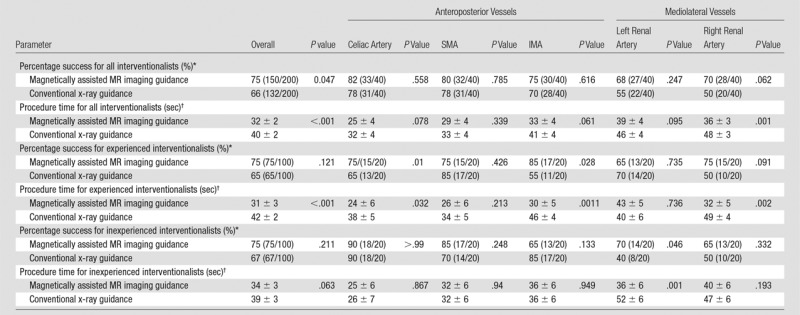
*Data are the percentage of success, with the numerator and denominator in parentheses.
†Procedure time data are presented in seconds as mean ± standard error of the mean.
Official websites use .gov
A
.gov website belongs to an official
government organization in the United States.
Secure .gov websites use HTTPS
A lock (
) or https:// means you've safely
connected to the .gov website. Share sensitive
information only on official, secure websites.
Navigation Success Rate and Time for 1.5-T versus 3-T MR Imaging
*Data are the percentage of success, with the numerator and denominator in parentheses.
†Procedure time data are presented in seconds as mean ± standard error of the mean.