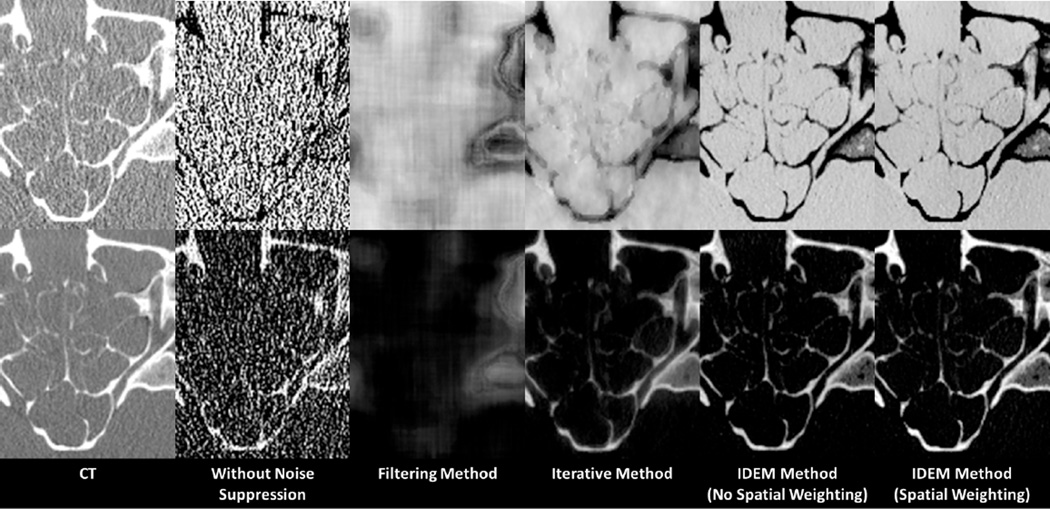
Fig. 11.
Zoom-in images of the anthropomorphic head phantom in the area indicated by the dashed box in Fig 9. The top-left and bottom-left images are 75 kVp and 125 kVp CT images, respectively. Within each set of decomposed images, the “tissue” image is shown in the top row, and the “bone” image is shown in the bottom row. CT images have a display window of [−500 1000] HU. Basis material images have a display window of [0.01 1.4].

