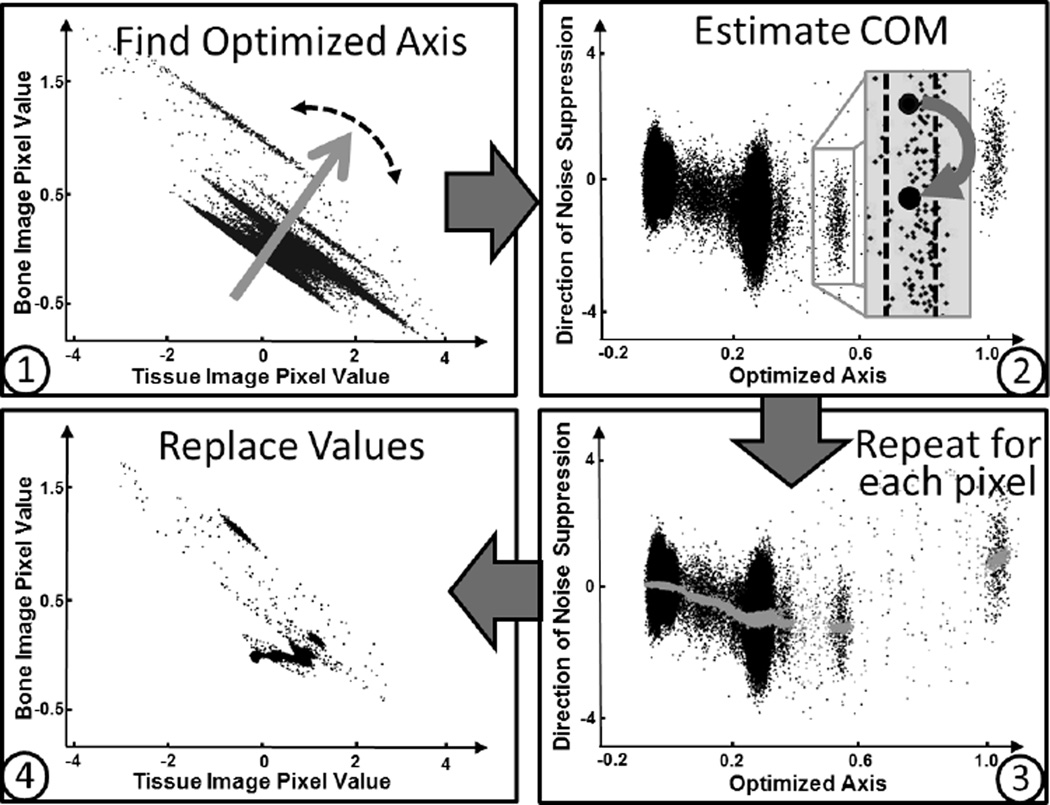
Fig. 2.
Outline of the IDEM method. The plot in Step 2 depicts the same data points as those in Step 1 rotated about the origin so that the optimized axis is horizontal. Note that different scales are used on the axes of the subfigures for improved clarity. In Step 3, the grey points are the COM estimates that will replace the black points.

