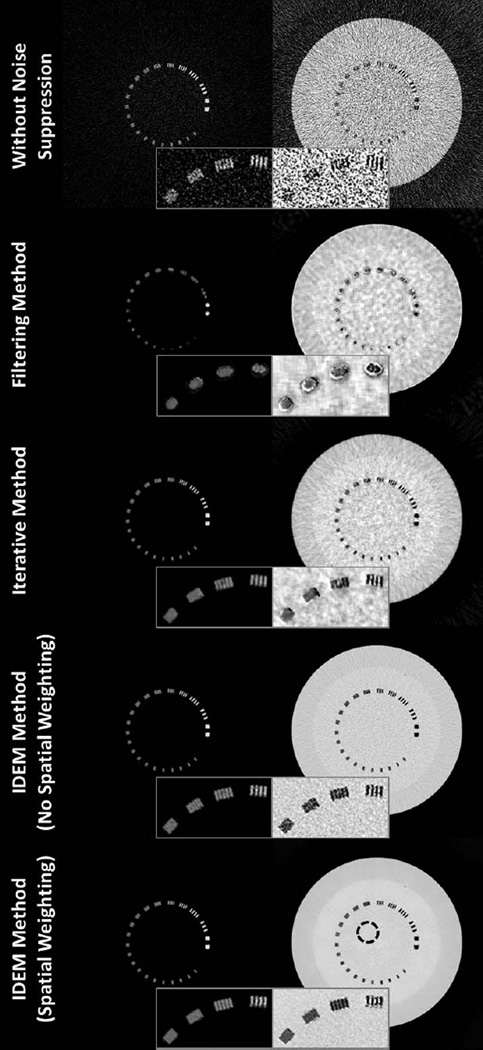
Fig. 6.
Decomposed images of the line-pair slice of Catphan©600 phantom. Within each image set, the “bone” image precedes the “tissue” image. The inserts are zoom-in images of line pairs with spatial frequencies from 5 to 8 line pairs/cm. In the bottom-right image, the dashed circle indicates the ROI used for the mean and noise STD calculations shown in Table I. The tuning parameters of the IDEM algorithm, (β,δ), are set to (1.27,9.5) when spatial weighting is not implemented and (1.32, 11.3) with spatial weighting employed. Display windows are [0.1 1.2].

