
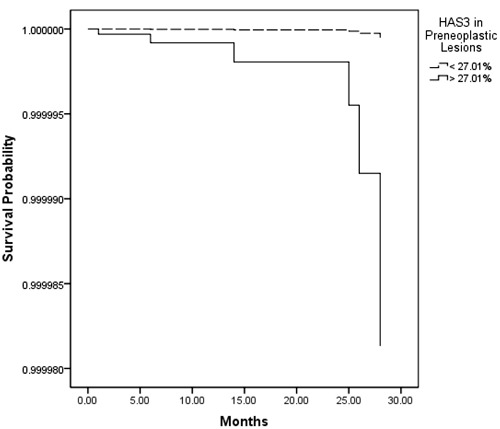
Figure 4. Regression plots of survival probability versus follow-up time in months for all patients. The dashed line indicates the group with <27% HAS-3; the solid line indicates the group with >27% HAS-3.
Official websites use .gov
A
.gov website belongs to an official
government organization in the United States.
Secure .gov websites use HTTPS
A lock (
) or https:// means you've safely
connected to the .gov website. Share sensitive
information only on official, secure websites.