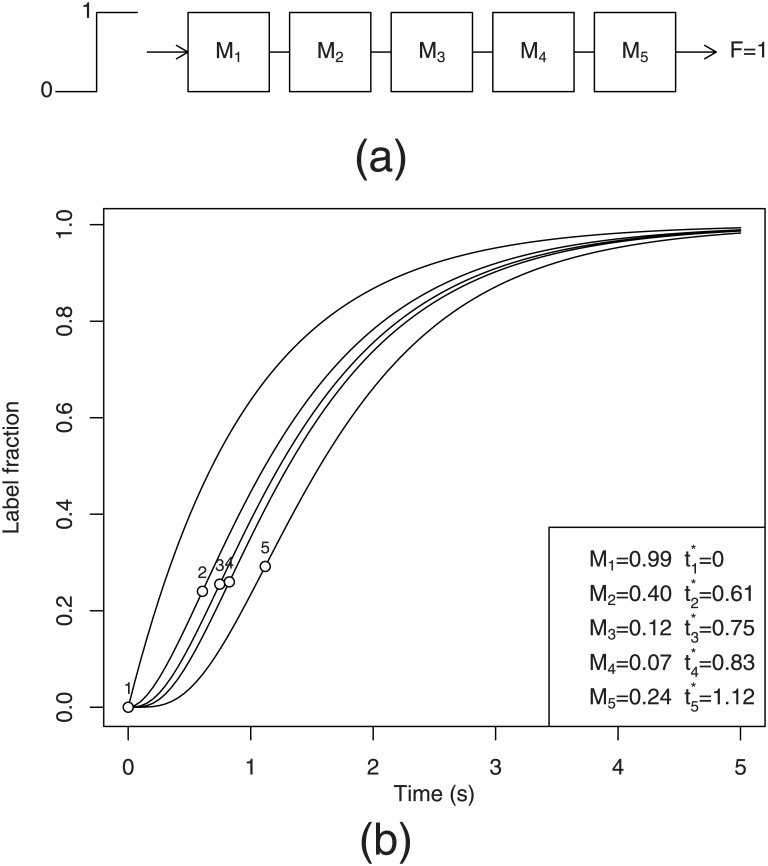
Fig 1. Labelling curves in a linear non-reversible pathway.
(a) A linear non-reversible pathway subjected to a step label input. (b) Label propagation curves for a linear non-reversible pathway of 5 randomly sized metabolites. Circles indicate the position of “label shock wave”, i.e. the time points at which the first derivative of each labeling curve reaches maximum. The values of the pool sizes M i and the shock wave positions are given in the legend.

