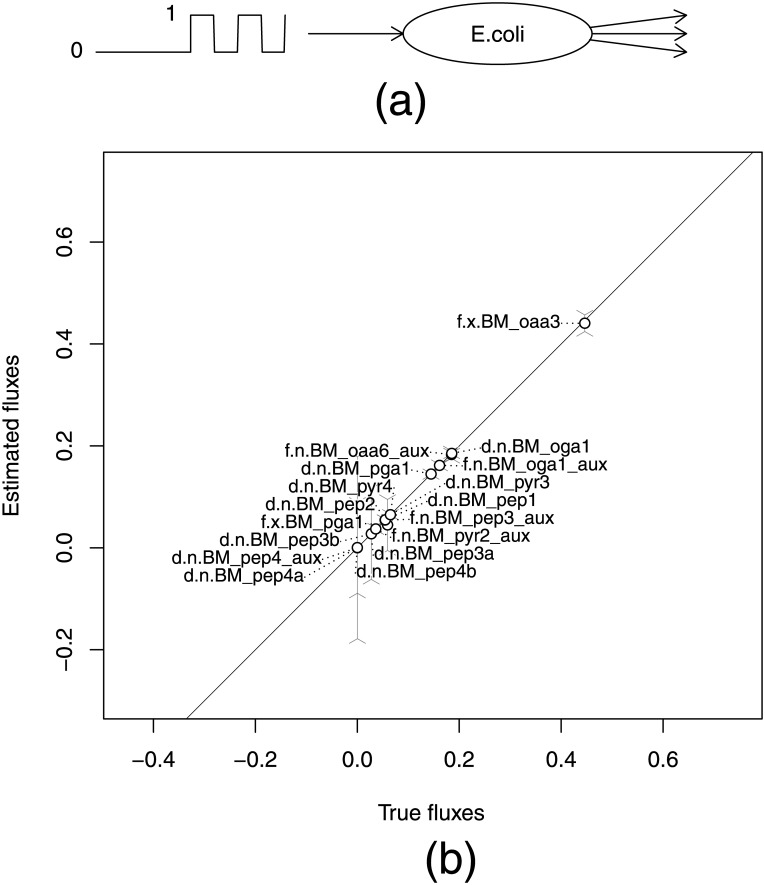
Fig 5. Comparison of estimated and true fluxes in a simulated RPP experiment.
(a) Scheme of RPP experiment on E. coli. Fully labeled glucose is fed to the culture in RPP form. Several aminoacids are measured by GC-MS. (b) Only statistically and structurally identifiable free and dependent fluxes (distinguished by “f” and “d” at the beginning of the flux names) are reported (17 of 70). The prefixes “n” and “x” in flux names correspond to net and exchange fluxes respectively. Exchange fluxes are mapped on [0, 1] intervals. Error bars correspond to 95% CI estimated by linearized statistics. The solid line indicates y = x positions. This example shows that in an RPP experiment, we can expect a good agreement between true and estimated values for identifiable fluxes.

