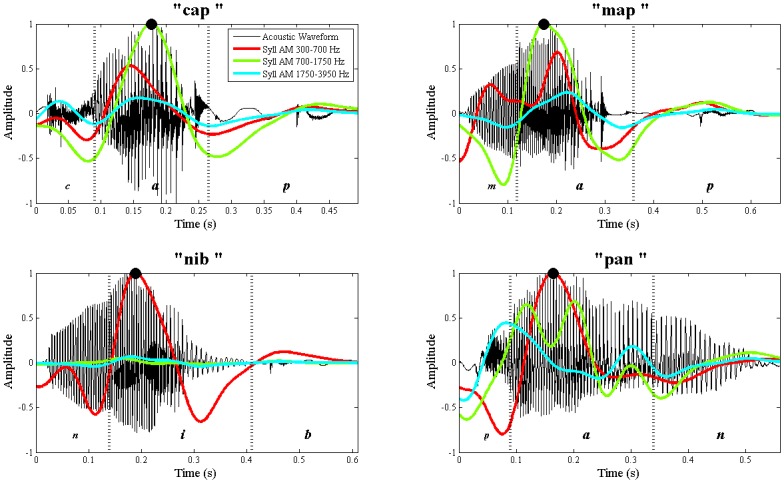
Fig 4. Acoustic waveforms and corresponding Syllable AMs for 4 different CVC syllables.

The syllables are: "cap" (top left), "map" (top right), "nib" (bottom left) and "pan" (bottom right). For each word, its acoustic waveform is shown in black, and the Syllable AMs from spectral bands 2,3 & 4 are overlaid as coloured lines. The vertical dotted lines in each plot indicate the manually-located boundaries between the onset, vowel nucleus and coda. Note that for each word, the highest Syllable AM peak (point of greatest energy) falls within the vowel nucleus, as indicated with black dots. However, the spectral band with the highest Syllable AM peak varies across words. For example, for "cap" and "map", it is spectral band 3 (700–1750 Hz, green) which carries the strongest peak. For "nib" and "pan", it is spectral band 2 (300–700 Hz, red) which carries the strongest peak.
