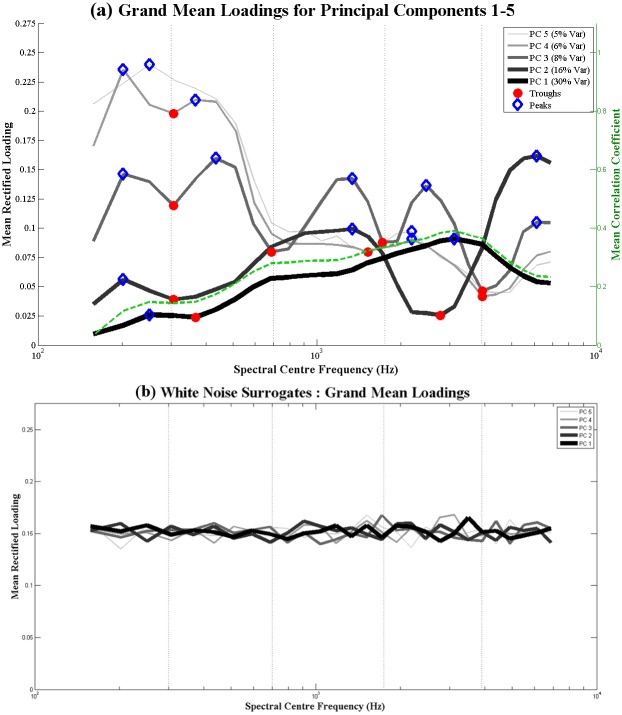
Fig 7. Spectral PCA loading patterns for CDS corpora (7a, top) and white noise surrogates (7b, bottom).
(7a) (Left y-axis) Grand average rectified loadings for the top 5 principal components arising from the Spectral PCA of the CDS corpora, averaged across all speech samples from 6 speakers. The blue diamonds mark peaks in loading and the red dots mark troughs in loading. On the basis of these peak and trough patters (see text), 5 spectral bands are inferred, whose boundaries are shown as vertical dotted lines. (Right y-axis) Grand average correlation coefficient between each spectral channel and all the other spectral channels, plotted as a dotted green line. (7b) Grand average rectified loadings for the top 5 principal components arising from the Spectral PCA of white noise surrogates of the CDS corpora, averaged across all speech samples from 6 speakers. Note that there is no systematic pattern of peaks.

