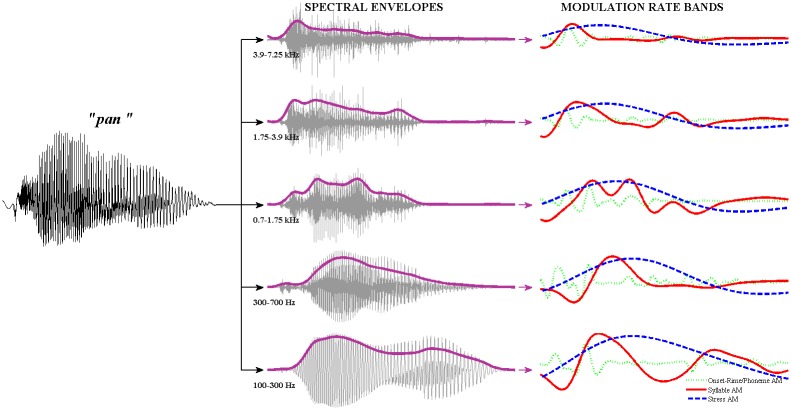
Fig 9. Example of the 5x3 spectro-temporal representation of speech modulation structure.
(Left column) Original acoustic waveform for the word "pan". (Middle column) 5-spectral band filtered signal with Hilbert envelopes from each spectral band overlaid in bold. (Right column) Final 5x3 spectro-temporal representation. 3 modulation rate bands (Stress, Syllable & Phoneme) are extracted from each of the envelopes in the 5 spectral bands. Each modulation rate band is plotted in a different colour.

