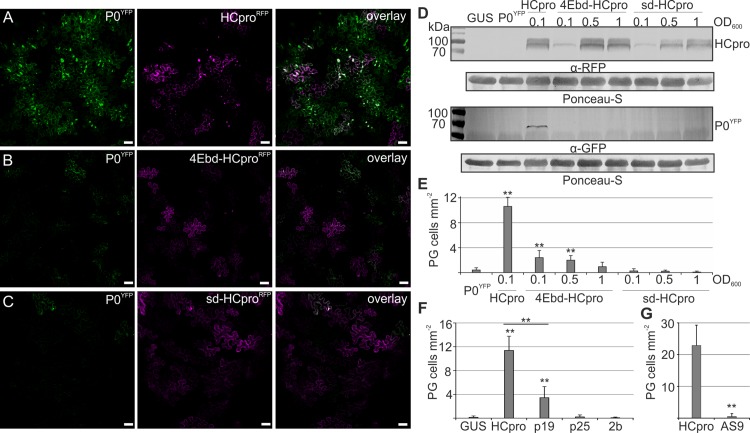
Fig 4. HCpro mutants lacking RNA silencing suppression and eIF4E binding are deficient in PG induction.
P0YFP was co-expressed with HCproRFP (A), 4Ebd-HCproRFP (B) or sd-HCproRFP (C) in N. benthamiana leaves using agroinfiltration. P0YFP and HCproRFP signals were detected by confocal microscopy at 3 DAI and presented as Z-stack projections covering an area of multiple epidermal cells to clearly convey the frequency of PGs. Scale bar; 50 μm. (D) In order to achieve comparable levels of native HCproRFP and the mutants, 4Ebd-HCproRFP and sd-HCproRFP expression was increased by increasing the Agrobacterium concentration used in infiltrations (indicated by the OD600 values). P0YFP was co-expressed with these. Protein accumulation was followed by western blot analysis using anti-RFP for HCpro and anti-GFP for P0 detection. (E) The frequency of cells/mm2 showing PGs was calculated using fluorescence microscopy in parallel with analyzing the protein levels in (D). (F) Frequency of cells/mm2 showing P0-labeled granules during co-expressed of P0YFP with plant viral VSRs HCpro, P19, 2b and P25. (G) Frequency of cells/mm2 showing YFP-tagged TuMV HCpro or HCpro AS9 in PG-like structures. The PG frequencies are presented as means and the error bars indicate the standard deviations. (p < 0.01 **, p < 0.05 *).

