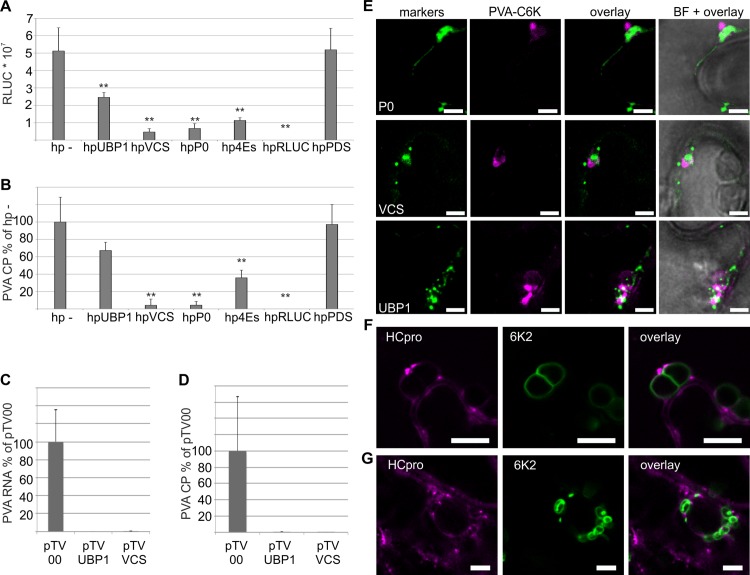
Fig 7. PGs are important for PVA infection and they can associate with viral replication complexes.
(A-B) PG-associated proteins UBP1, VCS, P0 and eIF4E/(iso)4E were silenced in N. benthamiana leaves via hairpin (hp)-constructs. Empty hairpin construct (hp-) and hpPDS were used as controls and hpRLUC to block infection via vRNA silencing. To initiate PVA infection from individual cells, RLUC-tagged PVAWT was inoculated using a low Agrobacterium density (OD600 0.0005). Infection was then allowed to spread from the initially infected cells in the silencing backgrounds. Six days later, viral RLUC activities (A) and the coat protein levels (B) were determined and they are presented as means with error bars indicating the standard deviation. (C—D) PG-associated proteins UBP1 and VCS were silenced in N. benthamiana using TRV-mediated VIGS followed by mechanical inoculation of PVA and quantification of PVA in systemically infected leaves using ELISA (C) and qPCR (D) at 7 DAI. (E) Plants were inoculated with PVA tagged with an additional copy of 6K2CFP and infection was let to spread into systemic, non-inoculated leaves. P0YFP, VCSYFP and UBP1YFP were subsequently expressed in the systemically infected leaves using Agrobacterium infiltration and imaged together with 6K2-labeled VRCs. The overlay shows PG-markers and VRCs as separate structures adjacent to each other in the presented single-layer images. Scale bar; 3 μm. (F—G) N. benthamiana plants were inoculated with PVA-HCRFP-6KY icDNA tagged simultaneously with HCproRFP and an additional copy of 6K2YFP (see schematic presentation of the construct in S1 Fig) using Agrobacterium infiltration (F) and virion inoculation (G). PGs were visualized via HCproRFP and VRCs via 6K2YFP in upper, non-inoculated leaves by confocal microscopy upon development of systemic infection, and presented as single layer images. Similar to (E) PGs were detected in the vicinity of VRCs as well as separated from them. Scale bar; 10 μm (upper) and 5 μm (lower). (p < 0.01 **, p < 0.05 *).

