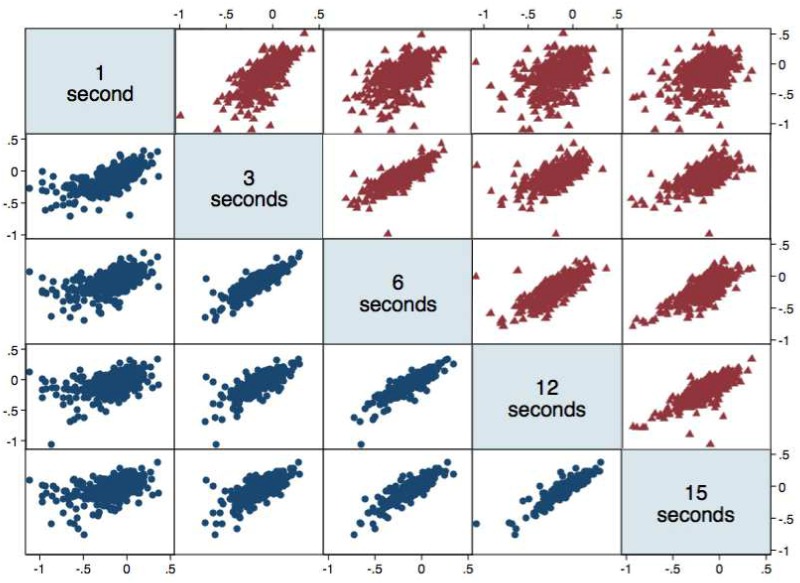
Fig 1. Correlations between 1, 3, 6, 12, and 15-second time production intervals.
Counting (circles) and timing production (triangles) correlations are shown at each requested interval. Values are plotted as the log transformed ratio of produced time to requested time. Due to the lower correlation for the 1-second intervals, this interval was excluded from production analyses. This figure exclude individuals (n = 10) who were outliers as explained in the methods.

