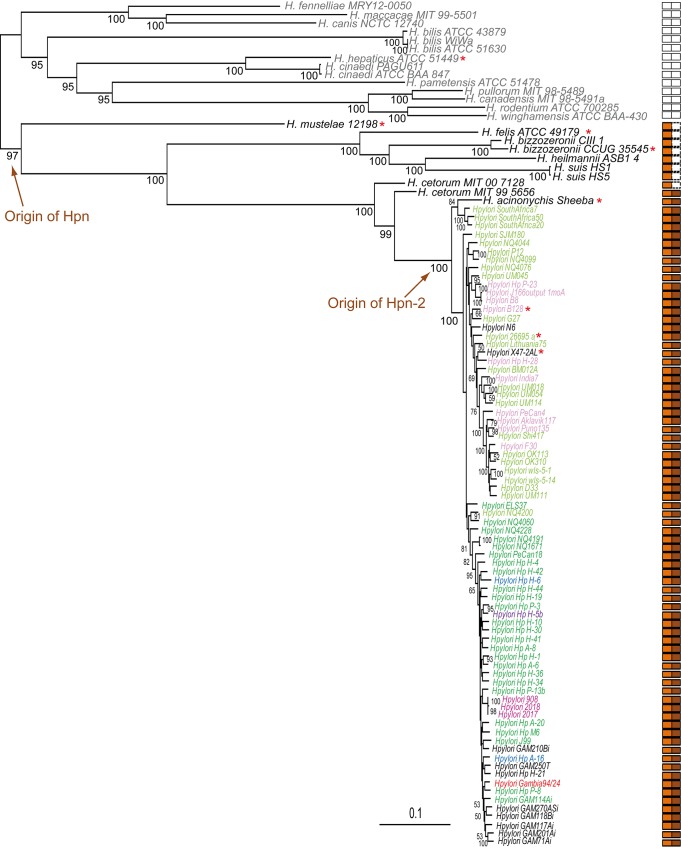
Fig 2. Maximum Likelihood phylogeny of a subsample of 100 out of the 330 Helicobacter strains analyzed in this study.
The enterohepatic and gastric strains are shown in gray and black, respectively. The tree is based on the 281 protein families present in a single copy in at least 320 out of the 330 strains (82,743 amino acid positions). Numbers at nodes represent bootstrap supports (for clarity only values > 50% are shown). The scale bar indicates the average number of substitutions inferred by site. Orange and brown rectangles show the presence of hpn and hpn-2 in the corresponding strains, while orange and brown arrows indicate the origin of these genes. Strains harboring similar genomic contexts of hpn and hpn-2 are indicated with similar color. Strains analyzed in this study are marked by an orange asterisk. Precise loci organizations are shown in Fig 3.

