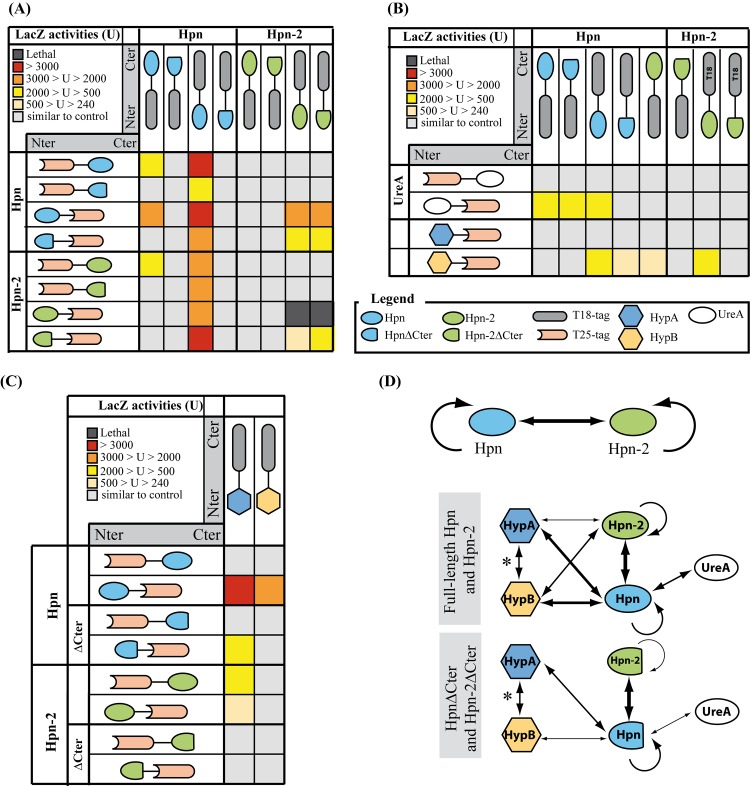
Fig 7. Analysis of the protein-protein interaction network of Hpn and Hpn-2 by in vivo BACTH.
(A-C) the tables represent the results of the β-galactosidase activity measurements on E. coli strains containing the pair-wise combinations of the different constructs. T18 and T25 correspond to the two fragments of the adenylate cyclase and the protein extremity at which the fusion was made (Nter or Cter) is shown. Panel A: interaction between Hpn, Hpn∆Cter, Hpn-2 and Hpn-2∆Cter. Panel B and C: interaction of Hpn, Hpn∆Cter, Hpn-2 and Hpn-2∆Cter with UreA, HypA and HypB. Red squares correspond to β-galactosidase activity that are > 3,000 U, orange squares between 2,000 and 3,000 U, yellow squares between 500 and 2,000 U and light yellow squares, between 240 and 500 U. None of the potential false positive interactions was presented (interactions of pUT18/pKNT25(Hpn) and pUT18(Hpn)/pKNT25 with ß-galactosidase activity below 600 units). Black squares represent combinations that lead to a lethal phenotype. The β-galactosidase activity values for each strain and the controls are indicated in S2 Table. (D) Schematic representation of the protein-protein interaction network of Hpn and Hpn-2. Thick arrows correspond to strong interactions, thin arrows to moderately strong interactions, according to the ß-galactosidase. * Indicates that this interaction was established before [53].

