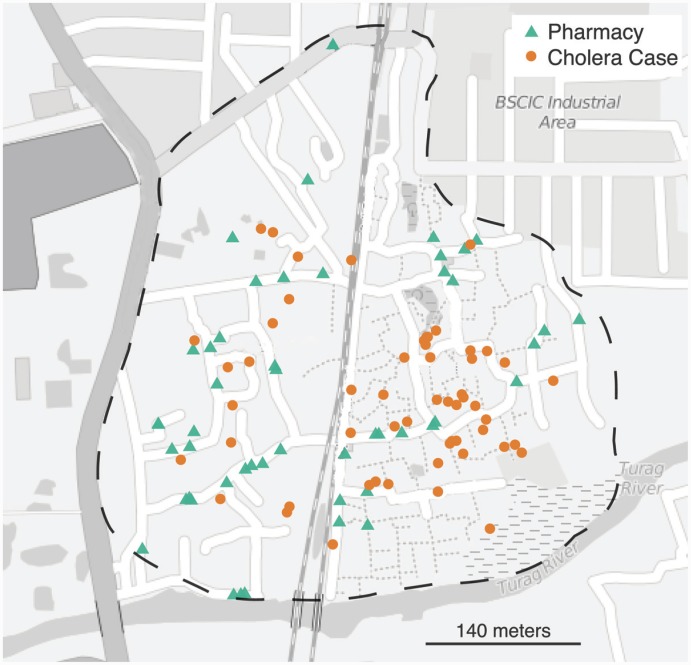
Fig 1. Locations of enrolled pharmacies and confirmed cholera cases.
Dashed line represents approximate boundaries of study area (Arichpur), green triangles represent enrolled pharmacies where ORS sales were tracked and orange circles represent the locations of confirmed cholera cases (n = 53 enrolled in household visit portion of the study). Base map courtesy of www.openstreetmap.org.

