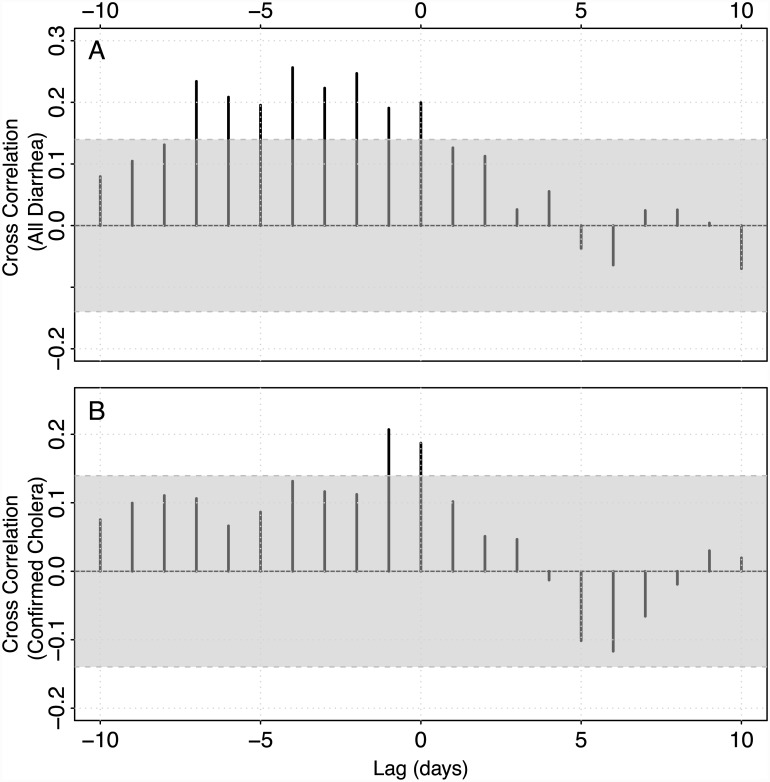
Fig 4. Cross correlation between mean community-wide excess ORS sales and all diarrhea (A) and cholera diarrhea (B).
Each bar represents the value of the cross correlation function for a specific lag between ORS sales and a specific outcome. The lag values represent the number of days that sales come after the case, so negative values refer to situations where ORS sales precede diarrhea cases. The 95% confidence band is shown in grey.

