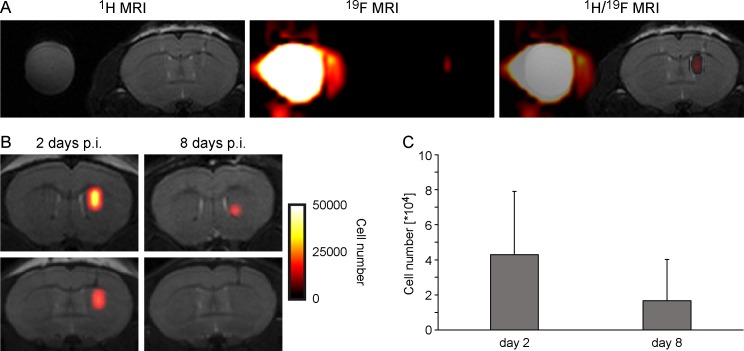
Fig 5. In vivo 19F MRI.
(A) High resolution 1H MR image (left) was acquired as anatomical reference and 19F MR image (center) was then acquired to localize the implanted cell graft. 1H and 19F images were superimposed to combine anatomical information and spatial graft localization (right). (B) Two animals with quantitative depiction of 19F-labelled detectable cells at both two and eight days post implantation. C) Quantification of hNSCs labelled with PFPE at both, day 2 and day 8.

