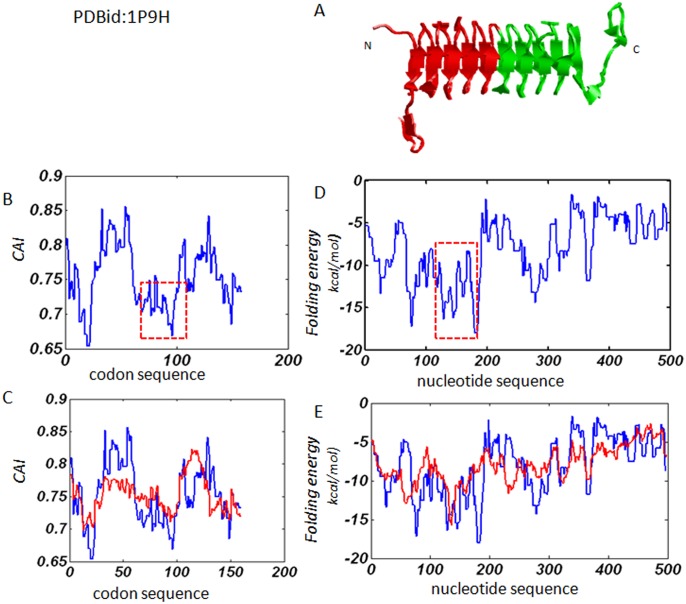
Fig 4. Results obtained from protein 1P9H.
(A). The cartoon structure, with the two symmetric substructures shown in red and green respectively. (B). The profile of local codon usage bias: the region with major decreases in CAI value is shown with dashed square lines. (C). The comparison between the profile of the natural gene sequence and the averaged profile of the same codon sequence randomized by 10 times. The blue line is for natural gene sequence and the red line is for the average of the random sequences. (D) and (E). The profile of local folding free energy and the comparison between the natural gene sequence and the random sequences, respectively. The blue line is for natural gene sequence and the red line is for the average of the random sequences.

