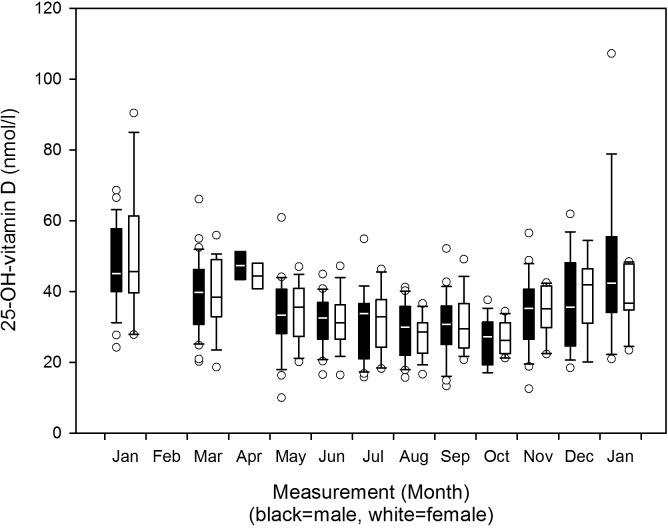
Fig 2. 25-OH-vitamin D serum concentrations 2007–2012: Boxplots per month separate for the sexes.
Changes of 25-OH-vitamin D serum concentrations from 2007 to 2012, boxplots per month separate for male and female participants (refer to Table 3 for n per month).

