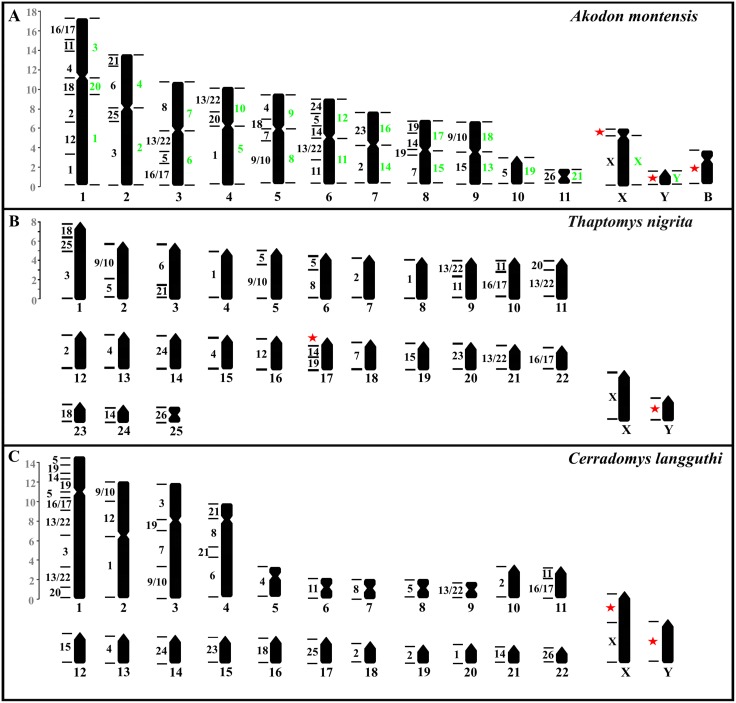
Fig 3. Ideograms of Akodon montensis (A), Thaptomys nigrita (B), and Cerradomys langguthi (C), showing chromosome homologies to Hylaeamys megacephalus (left black numbers) and Akodon paranaensis (right green numbers).
Red stars show regions without complementarity with the probes used. Scale shows the percent relative size of chromosome pairs. (Adapted from Ventura et al. [12], and Nagamachi et al. [17]).

