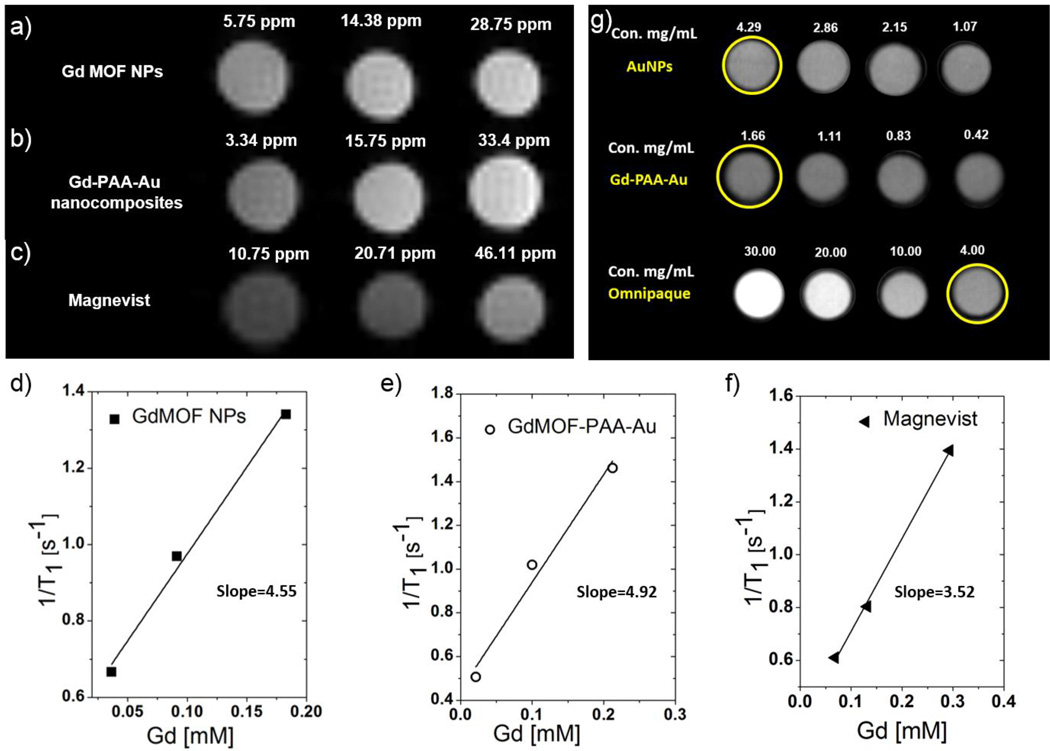
Figure 6.
T1-weighted MRI images of: a) unmodified GdMOF nanoparticles, b) GdMOF-PAA-Au nanocomposite, and c) chelate based Gd contrast agent (Magnevist) at various Gd concentrations in DIUF water. Relaxation rate (1/T1) of: d) unmodified GdMOF nanoparticles and e) GdMOF-PAA-Au nanocomposite and f) chelate based Gd contrast agent (Magnevist) as a function of the Gd concentration. g) CT images of: plain AuNPs, GdMOF-PAA-Au nanocomposite and the iodine-based contrast agent Omnipaque with different Au or iodine concentration. All concentrations are listed on top of each sample’s CT image.

