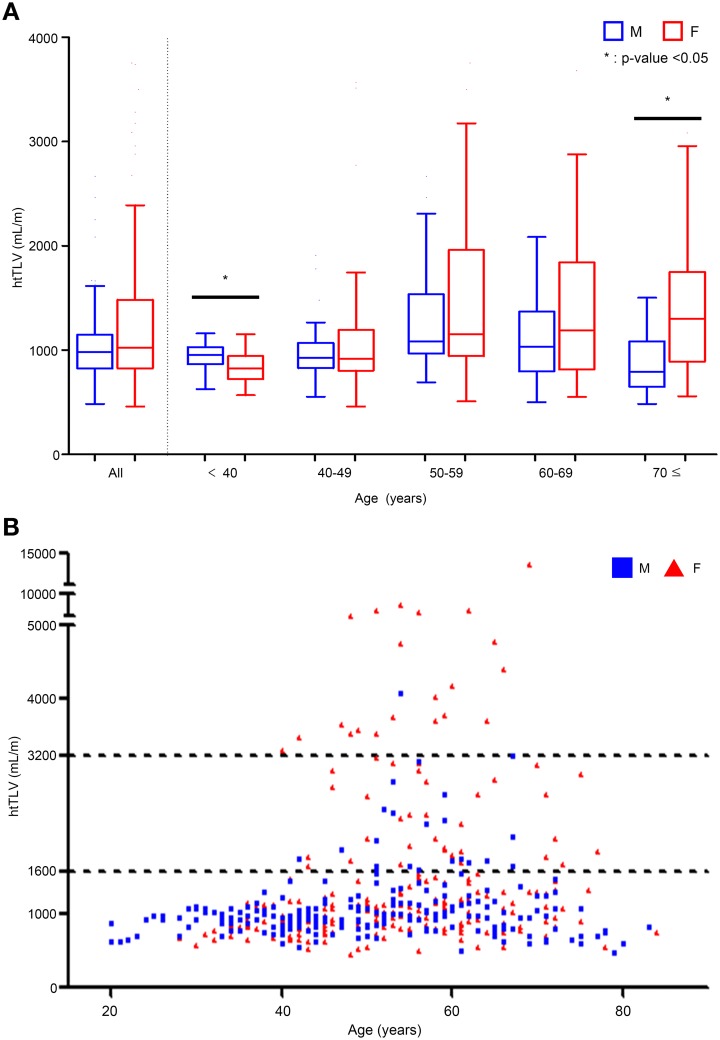
Fig 1. Distribution of height-adjusted total liver volume (htTLV) according to age and gender.
(A) Box plot of median (and inter-quartile range) of htTLV by age decades. The median htTLV was higher in males of age <40 and females ≥70 years (*P < 0.05 for gender difference). The skewing of htTLV towards larger size is most noticeable in females across all strata above 40 years of age, (P value for Jonckheere–Terpstra test for trend <0.001). (B) A scatter plot of htTLV by age and gender. Moderate PLD is moderately enriched by females and severe PLD, extremely enriched by females.

